Overview
The California Power Map is a mapping tool that provides, compares and visualizes data on California’s fossil fuel and bioenergy power plants. These data include the location of the plants, the demographics of nearby populations, and historical data about operations and greenhouse gas and air pollutant emissions (2010-present) for all California fossil fuel and bioenergy plants 10 megawatts and larger.
A free tool developed for researchers, citizens, community groups, non-profits and decision-makers, the California Power Map provides customized views – e.g. zip codes, counties, utility service areas, or filters to identify measures such as highest emissions and highest CalEnviroScreen scores – that can be shared as links or embedded on your site. We recommend using Firefox for an optimal web browsing experience.
Data are available in multiple views. Click below to explore:
- Statewide Demographic View: Map California power plants and visualize and compare demographic and environmental justice data for nearby populations.
- Statewide Operational View: Map California power plants and visualize and compare historical plant generation and emissions.
- Individual Plant Demographic View: Search for data on populations living near an individual power plant.
- Individual Plant Operational View: Search for individual power plants and visualize historic generation and emissions data.
- Plant Indicator Ranking: Rank plants by selected environmental or demographic indicators.
- Data Comparison View: Select, compare and plot user-specified data sets.
Quick Tips
- For a deeper view of specific maps or data: Select individual tabs.
- To explore connected visualizations: Select dashboard view.
- For a full-screen visualization: Click on the full-screen icon
 at the bottom right corner of a tab.
 - To download images or data from an individual plot or map: Click on the download icon
 at the bottom right of that figure.
 - To undo all filters: Click on the revert icon
 at the bottom right corner of a tab.
 - To embed or share a link to a specific map view: Click the share icon
 on the bottom right of your map results.
 - To re-center maps: Click on the home icon
 , which appears when you hover in the top left corner.
 - To look up terminology: The Glossary and Sources page includes definitions and data sources.
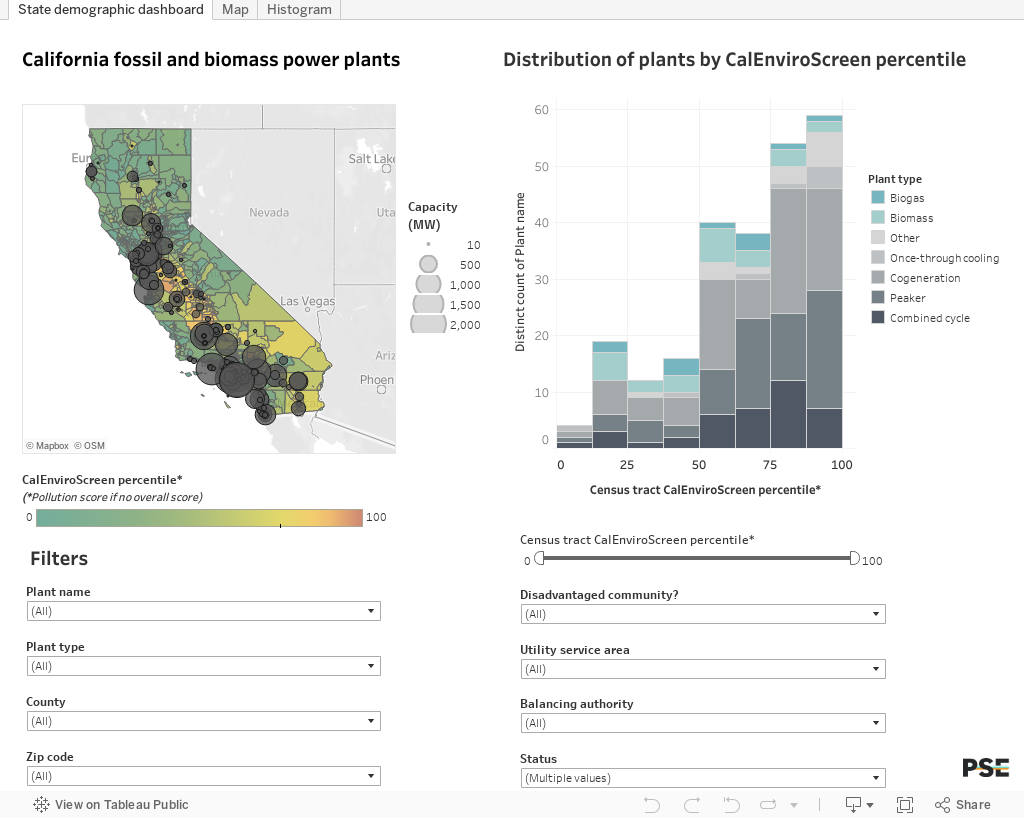
Statewide Demographic View
Explore a map of California’s natural gas and biomass plants in relation to demographic indicators and the state’s environmental justice screening tool, CalEnviroScreen. Hover or click on an individual plant on the map to pull up data on that plant. Use filters to select measures such as plant name, plant type or whether the census tract it is located in is considered a disadvantaged community.
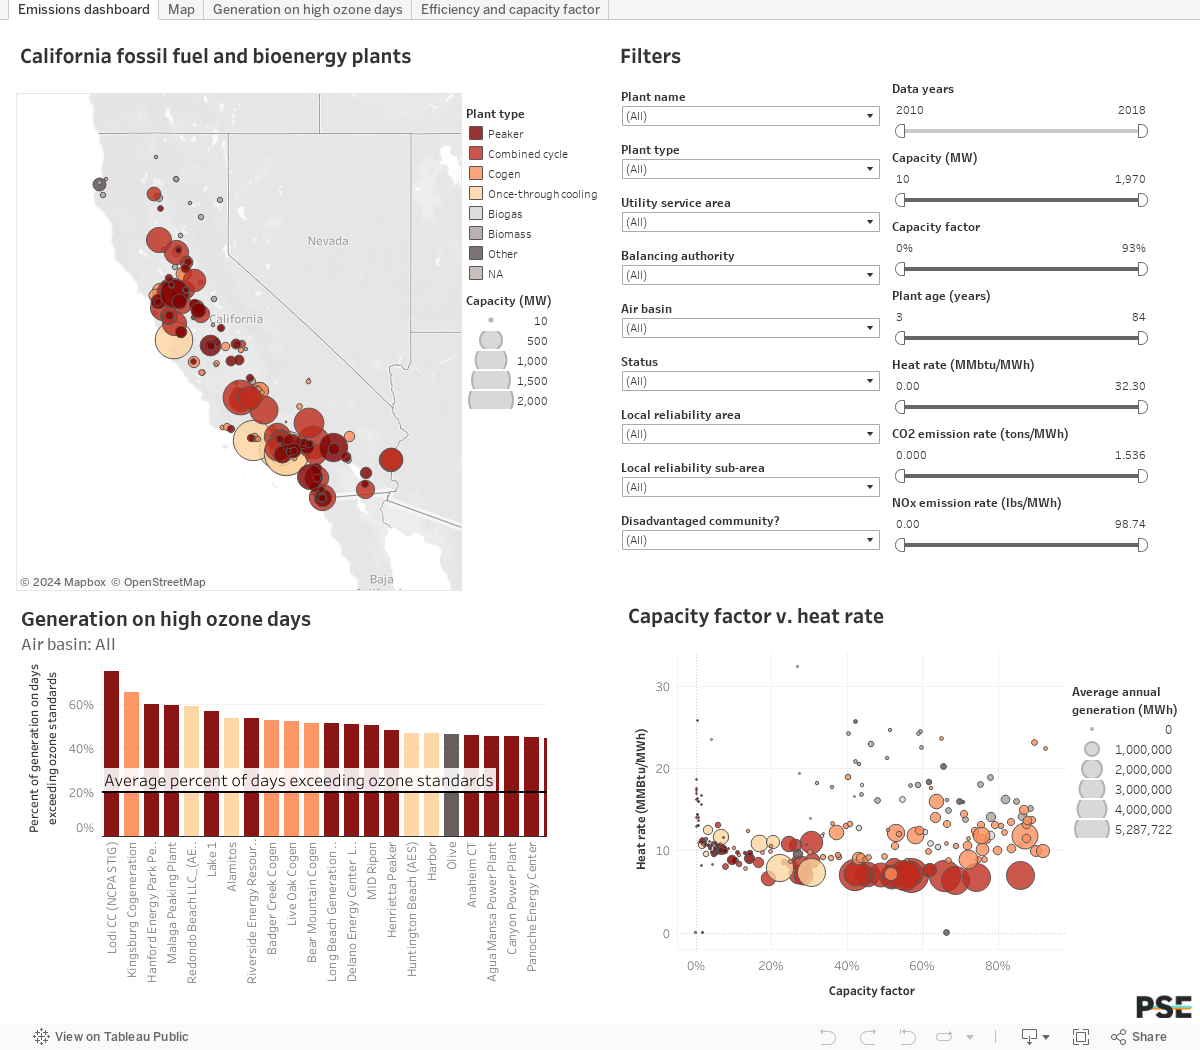
Statewide Operational View
Explore a map of California’s natural gas and bioenergy plants along with associated data on historical emissions (e.g. CO2 emission rate), operation (e.g. capacity factor), air quality (e.g. percent of generation on days exceeding ozone standards), and power plant status. Check the Glossary to look up unfamiliar terminology. Plant size or capacity is given in megawatts (MW), electricity generation is reported in megawatt-hours (MWh), and fuel consumption in million British thermal units (MMbtu).
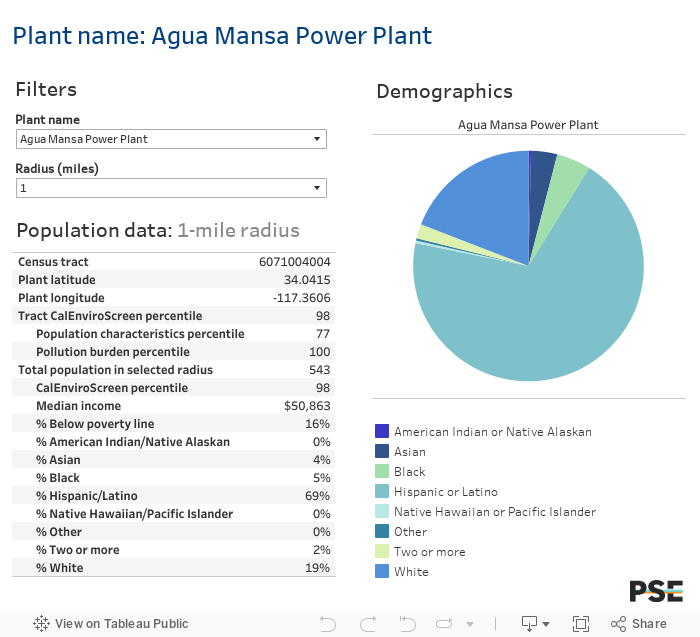
Individual Plant Demographic View
Look up an individual plant name to find information about the demographics of populations living near the plant. Select a radius of 1, 3, or 6 miles to find average data for populations living within the chosen distance from the plant.
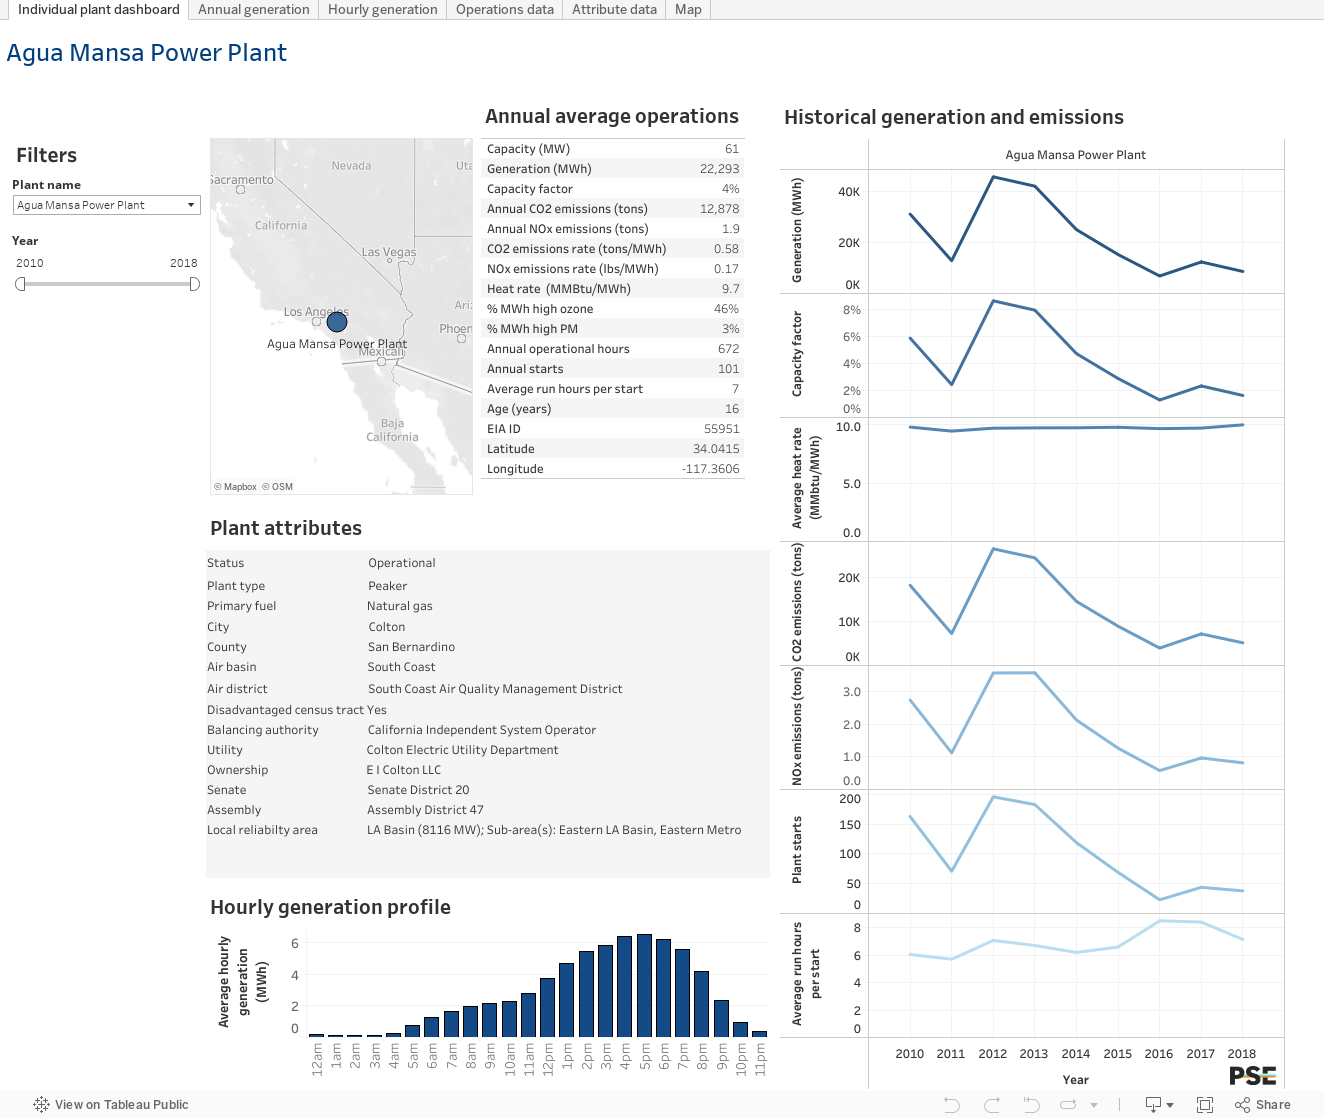
Individual Plant Operational View
Look up an individual plant name to find information such as where the plant is located and historical generation and emissions from the plant. Use the year filter to find the average annual generation and emissions over the selected time period. Click on additional tabs to look at a table or figure on its own.
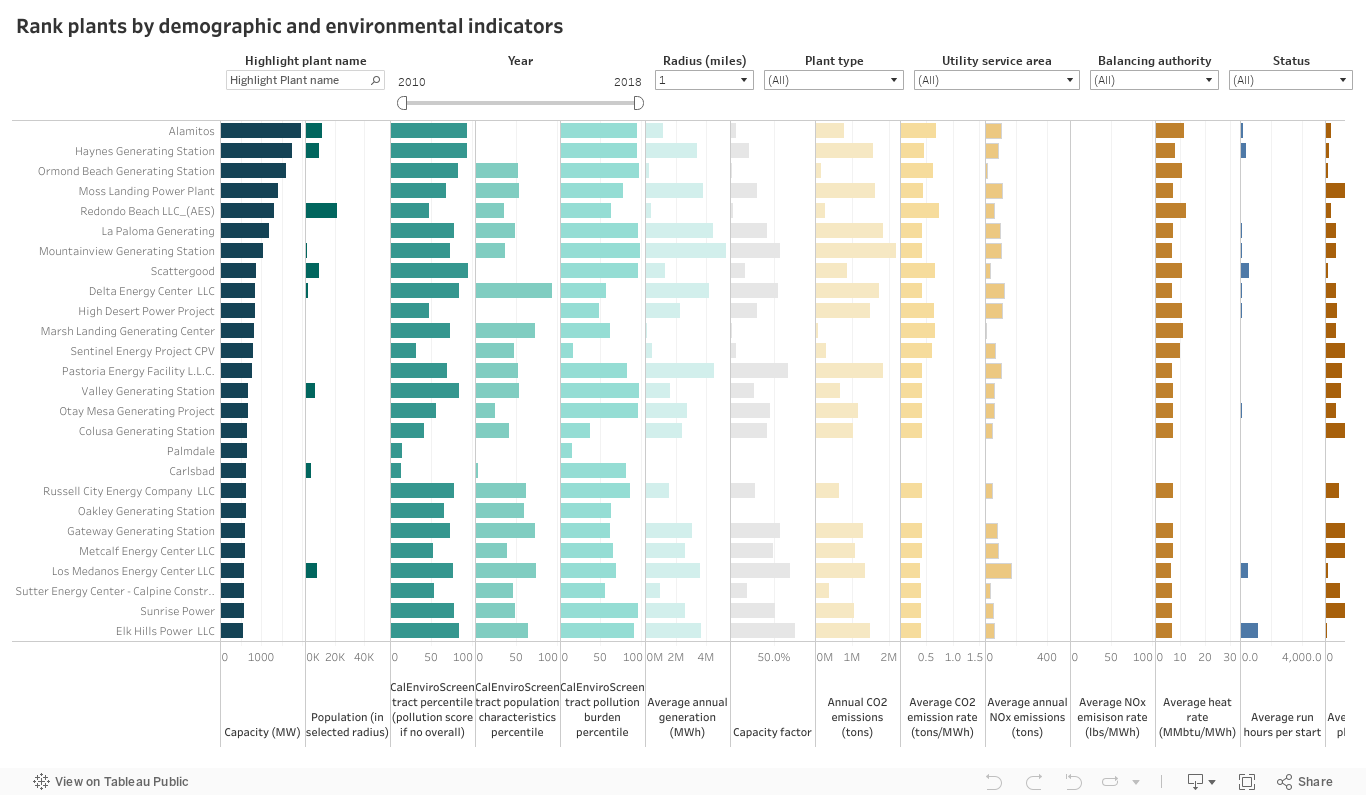
Plant Indicator Ranking
Click below the column for each plant environmental, operational or demographic indicator to re-rank the plants by that indicator value. By default, plants are ranked by capacity (size). Use filters to select the plant type, utility service area, or balancing authority, or select the years used to calculate operational averages or the radius used for population data.
NOTE: Some data, such as emission rates, are missing for certain plants.
Data Comparison View
Choose which datasets to compare to create your own plot. Select X-axis selector and Y-axis selector to choose two datasets to compare. Use the filters to isolate power plants in specific categories, such as utility service territory or plant type.
NOTE: Some data, such as emission rates, are missing for certain plants.
More Information
See Glossary and Sources for definitions and data sources.
See Methods for a complete description of how the data was compiled.
More Information
For questions, comments, or to report any errors in the data or trouble with the California Power Map, please ask Elena Krieger at: krieger@psehealthyenergy.org. These data are accurate to the best of our knowledge, but there are sometimes discrepancies in data aggregated from multiple sources and there may be errors in the compilation. We would appreciate any input if you notice any anomalies or inaccuracies to help improve the California Power Map. We are eager to help you navigate and use the tool, so please reach out if we can help you use the California Power Map to answer any specific questions!