Overview
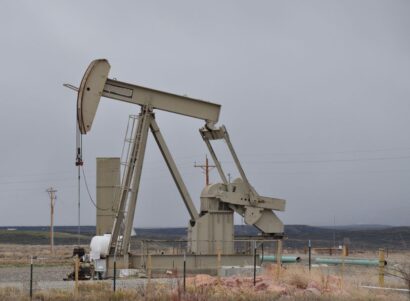
Drilling rates and average well production for Pennsylvania’s Marcellus Shale grew exponentially between 2004 and 2011. Depressed market prices due to over-production have since slowed new development, although there is considerable evidence to suggest a second “boom” is looming. Permitting records indicate growing demand for natural gas in the manufacturing and power sectors, as well as foreign markets, which can help to consume the current surplus and reduce constraints on market prices, thereby providing support for additional development. However, further development may have a high cost in terms of greenhouse gas (GHG) emissions.
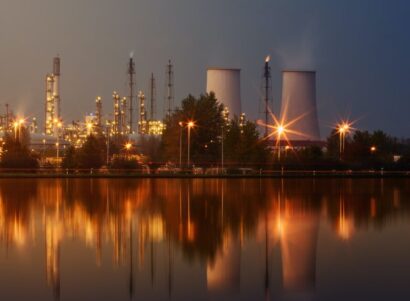
Natural gas is predominantly made up of methane (75% to more than 96%), a GHG 86 times more powerful than carbon dioxide, integrated over a 20-year timeframe. Natural gas systems are the largest source of anthropogenic methane emissions in the United States, as well as the third highest emitting source category for carbon dioxide emissions in the country.
This report presents a fuel cycle accounting of GHG emissions associated with projected development of the Marcellus shale in Pennsylvania to 2045. Emissions are based on projected Marcellus production. This report was supported by and prepared for The Delaware Riverkeeper Network.
Findings
- Permitting records suggest a potential doubling of natural gas demand in the Marcellus consuming region;
- Low regional natural gas spot prices, relative to the national benchmark, favor Marcellus production for supplying new demand both within and outside of the region;
- We estimate that between 1,600 and 2,000 new wells per year will need to be brought into production to meet the expected demand growth;
- GHG emissions associated with this level of development are projected to peak at 654 to 816 MMt of CO2e by 2025;
- Projected GHG emissions from Pennsylvania’s natural gas sector in 2025 are at least three times higher than comparable emissions in 2012;
- Fugitive methane emissions account for 37% of total projected fuel cycle emissions, with combustion emissions making up the remainder.

 Technical Report