Overview
The Candidate Resilience Hub Mapping Tool (beta) allows users to explore opportunities for resilience hubs in communities throughout California. This interactive map contains information about:
- potential resilience hub building sites (e.g., community centers, libraries, places of worship),
- local populations (e.g., CalEnviroScreen Score, poverty level, climate vulnerability), and
- local climate risks (e.g., extreme heat, poor air quality, public safety power shutoffs).
California’s Strategic Growth Council recently released nearly $100 million to support resilience centers across California. This tool has been released in its beta form in part to support groups applying for this funding; however, any efforts to identify, develop, and design resilience hubs should be led by or conducted in partnership with communities to ensure potential sites meet local needs and that designs reflect community-specific priorities.
Jump To:
Project Background
The Asian Pacific Environmental Network (APEN) defines resilience hubs as spaces where community members can access services for disaster response and recovery, as well as “to gather, organize, and access resilience-building social services on a daily basis.” According to the Urban Sustainability Directors Network (USDN), effective resilience hubs should also sustain operations during extended power outages.
In 2020, PSE Healthy Energy (PSE), APEN, and Communities for a Better Environment (CBE) embarked on a collaborative project to identify opportunities for resilience hubs throughout California. In May 2023, PSE released the California Public Safety Power Shutoff Interactive Map, which displays the frequency and duration of Public Safety Power Shutoff (PSPS) outages in California. The Candidate Resilience Hub Mapping Tool (beta) is the second interactive tool to be released through this project. For updates on this and future work from PSE Healthy Energy, join our mailing list.
This project is funded by California Strategic Growth Council’s Climate Change Research Program with funds from California Climate Investments, a statewide initiative that puts billions of Cap-and-Trade dollars to work reducing greenhouse gas emissions, strengthening the economy, and improving public health and the environment—particularly in disadvantaged communities.
How to Use the Tool
On the left-hand side of the map are toolbars that allow you to view different combinations of data on the map. This data is presented in two different formats: layers and filters.
- Data layers can be added to the map by selecting or deselecting checkboxes. For example, checking Very High under the Wildfire Hazard Severity Zone section adds an overlay of high-fire-risk zones to the map.
- Data filters change the subset of census tracts or resilience hub sites shown based on the selection. For example, moving the tab on the Projected Extreme Heat Days filter towards the right identifies census tracts that are likely to see the greatest increase in the number of extreme heat days. Likewise, deselecting Community Centers removes all resilience hub sites that belong to this category.
Understanding the Data Behind the Map
PSE’s Candidate Resilience Hub Mapping Tool (beta) allows users to explore three categories of data.
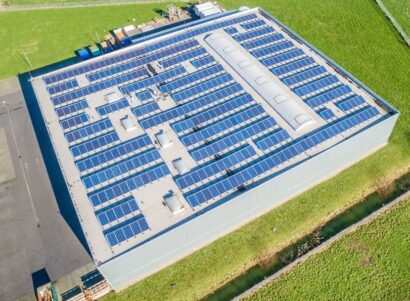
- Candidate Resilience Hubs: Many types of buildings may be suitable to serve as resilience hubs and meet the unique needs and risks of each community. In the Candidate Resilience Hub Mapping Tool (beta), PSE has identified a subset of candidate sites across California, including community centers, libraries, places of worship, schools, and community colleges. Most of these sites were identified using the OpenStreetMap.org database, the California State Library database, the National Shelter System Facilities dataset, and the California State Schools dataset; please let us know if you identify a site missing from our dataset. A viable resilience hub requires community leadership and participation in site selection and design and building community trust. Not all sites shown here will satisfy these criteria. Some other potential locations which are not displayed include government buildings, stadiums, and multifamily buildings because comprehensive statewide datasets are limited. For each hub, users can filter for five variables (defined below) Additional hub information is available by clicking on each individual site. Please note that solar+storage estimates are provided based on a 96 hour outage scenario in a low-solar irradiance month, during which sites can provide 50 percent of the energy used during normal operations.
- Electric Utility: Estimated based on utility GIS shapefiles. Solar+storage cost estimates reflect utility rates from the Utility Rate Database.
- Building Square Footage: Estimated using OpenStreetMap roof area and number of floors based on a Google Street View Sampling of sites.
- Rooftop Solar Capacity (kW): Estimated assuming 50 percent of the roof area is available for solar.
- Energy Storage (kWh): The battery energy storage required to operate throughout the outage scenario.
- Photovoltaic Size (kW): Rooftop solar installation size required to operate throughout the outage scenario.
- Upfront Solar+Storage Cost: Capital costs for solar+storage including applicable incentives and rebates.
- Lifetime Solar+Storage Value: The Net Present Value (NPV) of the installation, including the costs (upfront, operations and maintenance) and the benefits (reduced utility bills) converted to present-day value with an 8% discount rate.
- Upfront Solar+Storage Cost per Seat: Upfront costs per seat, with seat capacity estimated using daily average energy per person in the outage month based.
- Lifetime Solar+Storage Value: The Net Present Value (NPV) of the installation, including the costs (upfront, operations and maintenance) and the benefits (reduced utility bills) converted to present-day value with an 8% discount rate.
- Seats Capacity: The maximum number of people that can simultaneously be served with a site providing 50 percent of normal energy operations during 96-hour outage.
- Population Vulnerability Indicators: Included as the map background layer at the census tract level in a green-yellow-red color palette. The Population Vulnerability Indicator filter includes three different options for selection. The three indicators are shown in the map as percentile rankings. For example, a census tract ranking in the 90th percentile would have a higher score than 90 percent of census tracts in the state.
- CalEnviroScreen 4.0: This environmental justice screening tool, developed by the California Office of Environmental Health Hazard Assessment, reflects cumulative sociodemographic and environmental pollution indicators.
- Climate Vulnerability Index: This index expands upon the CalEnviroScreen 4.0 to include indicators of adaptive capacity, such as social capacity, population capacity, and infrastructure capacity, to better capture climate vulnerability.
- Low-Income Households: Percentage of households with incomes below two times the federal poverty level.
- California SB 535 Disadvantaged Communities (DACs): DACs are targeted for investment of proceeds from California’s Cap-and-Trade Program. DAC designations are based on CalEnviroScreen scores and other factors. To learn more, please visit the SB 535 DAC website.
- Justice 40 Disadvantaged Communities: Communities designated as disadvantaged in the Climate and Economic Justice Screening Tool. The tool uses datasets that are indicators of burdens in eight categories: climate change, energy, health, housing, legacy pollution, transportation, water and wastewater, and workforce development. Please visit the Climate and Economic Justice Screening Tool website to learn more.
- Climate Hazards: Climate hazard refers to the potential occurrence of extreme events, caused or exacerbated by climate change, that can damage infrastructure or harm physical or mental health. These events include but are not limited to hurricanes, severe storms, heat waves, drought, wildfires and smoke events, flooding, and sea level rise. The tool includes five categories of climate-related hazard filters and map layers.
- Projected Extreme Heat Days: Projected days with a maximum temperature above the 98th percentile of the local historical temperature for years 2030-2050 based on Climate Scenario RCP 4.5. The estimates rely on local historical temperature data from 1961–1990 between April and October.
- Ozone and PM2.5 Exceedance Areas: Ozone and fine particulate matter (PM2.5) are criteria pollutants federally regulated under the Clean Air Act through the National Ambient Air Quality Standards. These filters allow the user to identify census tracts in areas that do not meet the national air quality standards for these pollutants.
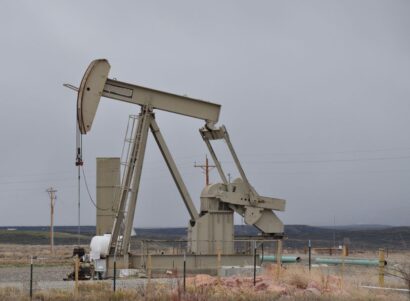
- Public Safety Power Shutoffs (PSPS): Estimated number of PSPS outages per year for census tracts served by investor-owned utilities. Estimates are based on the number of PSPS events called for circuits in each census tract from utility-reported data between 2013 and 2022.
-
Wildfire-related PM2.5: Estimated annual average PM2.5 concentrations attributed to wildfire events. Estimates are based on wildfire events from 2006-2020 and integrate satellite, local air monitors, meteorological data, and more. For details about the methodology, see Aguilera, R et al., Environment International, January 2023.
- Fire Hazard Severity Zones: Moderate, high, and very high wildfire hazard severity zones are delineated by CAL FIRE (2022). The user can add this layer to the map to visualize census tracts in or adjacent to high-risk fire areas.
It is important to note that scientists pulled this data from a wide range of publicly available sources and the tool may therefore include some inaccuracies or duplications of data. Solar+storage estimates are based on aggregate averages (e.g. assuming 50 percent of rooftop area is available) and would need to be tailored to the specifics of each site to develop resilient solar+storage designs. Please contact us to provide feedback and suggestions for improving the tool and the underlying data, which are currently presented in beta form.
Contact Us
We appreciate your feedback and support in helping us improve the tool and the underlying data, which are currently presented in beta form. Please submit any comments or suggestions in the form below.