More extreme weather is increasing power outages, both in California and across the U.S. But local governments and community-based organizations need to understand their community’s risk of outages to pursue smart resilience solutions. This can be tricky, though. Different types of outages are reported in different ways, making it complex and time consuming for communities to quantify their resilience needs and obtain the funding necessary to prepare for future emergencies.
One type of outage, Public Safety Power Shutoffs (PSPS), has strict reporting requirements, giving us a unique opportunity to study them. After mapping these outages to census tracts, we see that people across the income and privilege spectrums have experienced PSPS events. However, we know the impacts of this sort of emergency hit low-income and historically disadvantaged communities the hardest, as they face overlapping vulnerabilities that can make it more difficult to weather a crisis.
PSPS outages occur when utilities proactively cut power to certain electrical circuits during high fire conditions to lower the risk of their equipment igniting a wildfire. Years of drought and neglected maintenance resulted in some of the most devastating fires the State has ever seen, including the Camp Fire in 2018 that burned more than 153,000 acres and resulted in 85 deaths. But while PSPS events lower the risk of wildfires, they can have their own serious consequences. On average, households have lost power for 48 hours—providing ample time for food and medication to spoil in refrigerators, people to miss work or school, and those who rely on electrical-powered medical devices to suffer.
Millions of Californians have experienced PSPS events. So to start bridging the gap between utility reliability reporting and community resilience planning, we can use data on these outages as a proxy for typical outage durations and call for more accessible data on other types of outages.
Mapping Public Safety Power Shutoffs
California has six investor-owned utilities: Pacific Gas & Electric (PG&E), SoCal Edison (SCE), San Diego Gas & Electric (SDG&E), PacifiCorp, Liberty, and Bear Valley Electric Service (BVES). Each is subject to rich data reporting requirements around PSPS events. While these utilities operate alongside 46 publicly-owned utilities and rural electric co-ops, they provide electricity to almost 90 percent of California’s residents. Using their post-event reports and the location of circuits throughout the state, we were able to map PSPS outages across investor-owned utility service territories. This post focuses on mapping these outages. To dive into a statistical analysis of this data, read Preventing Wildfires with Power Outages.
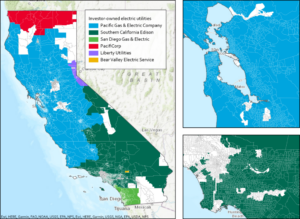
Figure 1. The service territories of California’s six investor-owned utilities, which cover almost 90 percent of California’s residents. Areas in white are served by publicly-owned utilities and electric co-ops, which are not required to report similar data.Data from the California Energy Commission’s Electric Load Serving Entities (IOU & POU) dataset.
After mapping outages to circuits we assigned outages and their impacts to census tracts (Figure 2). This allowed us to see differences in PSPS severity between locations and populations. By comparing census tract level impacts we analyzed how outage frequency and duration correspond to socio-economic and demographic information. While utility-reported data includes some information on impacted customers, such as whether they’re residential or commercial accounts, it doesn’t indicate whether a customer experiencing a given PSPS outage is low-income or part of a disadvantaged community.
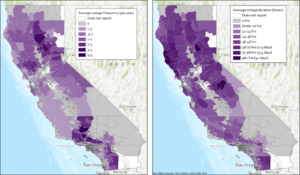
Figure 2. Public Safety Power Shutoff frequency (left) and duration (right) by census tract. Zoom into the maps and use the relevant filters on the Public Safety Power Shutoff tool to explore this data in more detail.
Knowing who is experiencing outages, how often they happen, and how long they typically last are critical pieces of resilience planning. For instance, communities designing solar and storage resilience hubs should consider the typical dates and duration of power outages to determine how much solar and energy storage is needed to meet critical demand. This information may also inform the types of services resilience hubs need to provide and for how many people. For example, if power outages happen more frequently in the summer, more backup power may be needed to run air conditioning. Meanwhile, communities where fewer people are impacted by outages may need less backup power to meet resilience needs.
The map shows the frequency and duration of previous PSPS events. However, these are only one type of outage. A community may primarily experience outages from other causes, such as new powerline safety settings or neglected maintenance. The map is also not exact, as discrepancies arose from using publicly available data and statistical methods to map impacted circuits to census tracts in the absence of private data available only to the utilities. Caveats to this map include:
- A lack of data on whether publicly-owned utilities and rural electric co-ops have instigated PSPS events. This is particularly important in the Los Angeles area, where four million people are served by the Los Angeles Department of Water and Power (LADWP).
- Missing circuit locations, based on what data is publicly accessible. While this map includes the majority of circuits impacted by PSPS events, some outages are missing.
- Incomplete information on circuit sectionalization. Utilities now sectionalize their circuits, only shutting off power to specific portions of a line. Because the specific locations of de-energized segments are mostly unavailable, impacted households may be assigned to the incorrect census tract.
- Assumptions around impacted demographics. Utilities aren’t required to report the demographic or socio-economic information of all households impacted by PSPS outages. Thus, we can’t say for certain that a low-income household did or did not experience a given PSPS event. We can theorize based on census tract level information, but getting more specific requires privacy-protected data.
When and Where are Public Safety Power Shutoffs Happening?
As we’ve shown before, PSPS events are most common in October. This is likely because low fuel moisture content coincides with California’s dry Diablo and Santa Ana Winds, creating the right conditions for a spark to turn into a blaze.
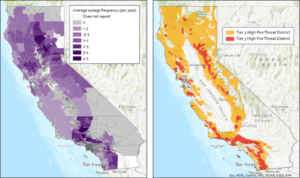
Figure 3. Public Safety Power Shutoffs (PSPS) by frequency (left) next to California’s high fire threat districts (right). If the infrastructure that delivers a community’s power runs through a high fire threat district, it’s at higher risk of a PSPS event.
As you can see in Figure 3, PSPS outages are concentrated in and around high fire threat districts. These districts are regions where the California Public Utilities Commission, CalFire, and others determined utility infrastructure poses the greatest fire risk. Roughly 20 percent of census tracts served primarily by investor-owned utilities are at least 25 percent within a high fire threat district. Of these census tracts, 75 percent have experienced at least one PSPS outage. But PSPS events are also called outside of these areas, as numerous census tracts have electrical infrastructure that runs through a high fire threat district somewhere along the line.
Figure 4 below shows that census tracts in Kern, Los Angeles, and Ventura Counties have experienced the most frequent PSPS outages. Census tracts in these areas (served by either SCE, PG&E, or both) have lost power, on average, 4-5 times a year since their utilities started conducting PSPS events. While none of these census tracts are designated as disadvantaged communities, roughly 20 percent of them have an above average percentage of low-income households. That is, up to 36 percent of households live at or below 2x the Federal Poverty Level—a cutoff used to determine eligibility for certain low-income energy assistance programs. Across California, an average of 31 percent of households in each census tract live at or below this level.
While the greatest number of outages took place in Southern California counties, the longest outages took place further north in Butte, Madera, and Mariposa Counties, which are served by PG&E. There, some PSPS outages lasted two weeks or more. In a couple of instances, utility infrastructure was damaged by the weather event and repairs took over a month. But even excluding these events, census tracts in these three counties have some of the longest single outages and longest average outage durations (Figure 4), showcasing the need for local resilience solutions to withstand long outages.
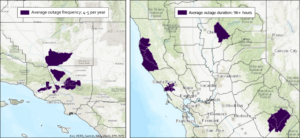
Figure 4. Census tracts that experience the most frequent outages, on average 4-5 times a year (left). Census tracts that experience the longest average outage durations (right). Use the relevant filters on the Public Safety Power Shutoff (PSPS) map tool to explore this data in more detail.
A census tract in Butte County, home to Berry Creek near Chico and the fire-impacted town of Paradise, has the highest annual average and highest total “outage customer hours.” “Outage customer hours” is an outage’s duration multiplied by the number of customers impacted by that outage. It serves as a measure of scope, allowing us to more easily compare between areas where a lot of people experienced shorter or more frequent outages and areas that experienced longer outages that only impacted a few households. In this case, it signifies that this census tract had, on average, more people impacted for more hours than any other census tract. While California doesn’t consider this community disadvantaged, half of its population lives below 2x the Federal Poverty Level.
The Intersection of Disadvantaged Communities and Public Safety Power Shutoffs
At first glance, it doesn’t seem like disadvantaged communities experience more frequent or more severe PSPS events. However, that doesn’t mean these communities aren’t being disproportionately impacted.
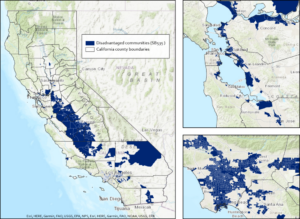
For the most part, disadvantaged communities (as seen in Figure 5) are census tracts that scored at or above the 75th percentile of the latest CalEnviroScreen. Roughly a quarter of census tracts served primarily by investor-owned utilities are considered disadvantaged. However, only three percent of these disadvantaged communities are within a high fire threat district. So while it can appear as though disadvantaged communities experience significantly fewer PSPS events, disadvantaged census tracts within high fire threat districts experience PSPS outages about as often as their non-disadvantaged counterparts.
Almost 40 percent of disadvantaged census tracts are served by utilities that don’t report on PSPS to the California Public Utilities Commission, so were not included in this analysis. In particular, half of all disadvantaged census tracts in California are in Los Angeles county. As seen in Figure 5 below, a significant portion of this county does not get its electricity from an investor-owned utility regulated by the Utilities Commission.
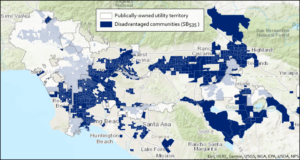
Figure 6. Large areas in and around Los Angeles do not have one of the investor-owned utilities, which are subject to Public Safety Power Shutoff (PSPS) reporting requirements by the California Public Utilities Commission, as their electricity provider. Thus, these areas were not included in this analysis.
Brockway et al. illustrated that the limitations of grid infrastructure in historically disadvantaged communities can lower access to distributed energy resources like solar. This can deepen existing inequities by barring members of marginalized communities from the benefits of solar, storage, electric vehicles, and other emerging technologies. So a possible connection, or lack thereof, between disadvantaged communities and PSPS outages still warrants further exploration. There are also other types of outages to consider, such as those caused by the new “fast trip” settings on some of PG&E’s power lines, which are not included here.
Regardless of outage frequency, disadvantaged communities feel the impacts of PSPS events more acutely. People who were more vulnerable reported greater levels of post traumatic stress and worse physical health outcomes from PSPS events during research conducted by Wong-Parodi et al. after widespread outages in 2019. Lost wages and food spoilage are harder to bounce back from for households with lower incomes. And these families are also less able to afford to stay somewhere else during a long outage.
The mental, physical, and material toll of an outage may be compounded by the additional stressors burdening these communities and lead to worse outcomes overall. According to the Federal Reserve Board, more than a third of U.S. adults would be unable to easily cover an unexpected $400 expense. This percentage increases for lower-income families. Additionally, Black and Hispanic individuals were more likely to face difficulty paying monthly expenses, regardless of income level. For low-income households and members of disadvantaged communities, PSPS outages that cause missed work and unexpected expenses can chip away at savings, leaving less to cover monthly bills and other emergencies like car or medical troubles. And for those who are also medically vulnerable—such as the elderly, people who suffer from chronic illness, or those who require electricity-dependent medical devices—an outage can have additional repercussions.
Paired solar and battery storage can provide critical backup power during an emergency. But research by Lukanov & Krieger, Sunter, et al., and Brown has shown that the adoption rates of these technologies are higher in wealthier, non-environmental justice communities. Installing an energy resilience solution such as solar and storage requires owning a home with rooftop space suitable for solar panels, as well as access to up-front capital and financing. This is simply more accessible to wealthier, whiter households.
For any type of power outage, PSPS or otherwise, disadvantaged communities are at greater risk. They are less likely to have resilience solutions like solar and energy storage and more likely to be pushed into poverty by the financial shock of this emergency.
Community Resilience Planning Depends on Accessible Data
While this mapping effort focused on PSPS events, these are only one type of outage. Other outages, such as those triggered by new powerline safety settings or directly caused by inclement weather, weren’t included in this analysis. This was done, in part, because of how utilities in California report their outage data.
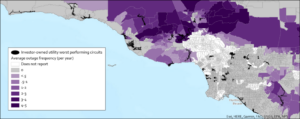
Figure 7. The worst performing circuits from SCE’s 2020 annual reliability report overlaid on the average annual PSPS outage frequency between Santa Barbara (top left) and Laguna Niguel (bottom right). While areas in gray have not experienced PSPS outages, households along these poorly performing circuits are impacted by other outages and reliability concerns.
Investor-owned utilities are required to file detailed reports after each PSPS event. These reports include the names of impacted circuits, outage times, the number of customer meters impacted, and more. Over time, reporting requirements have also become more inclusive. As of mid-2021, utilities even provide maps that show where customers lost power. So while mapping these outages still requires certain assumptions and caveats, the detail in these reports enables researchers and community groups to better understand a census tract’s risk profile for PSPS events and make decisions accordingly.
However, utilities don’t have the same reporting requirements for other outages. Most utility websites have maps that indicate which areas in their service territory are currently without power or have upcoming outages scheduled. But these maps only reflect the grid’s current status. Once an outage is over, this information is less accessible. Data from these outages are eventually compiled into a utility’s annual reliability report. These reports focus on system- and division-level reliability, though, rather than census tracts or the neighborhoods within them. Reliability reporting divisions are wide, spanning communities across the socio-economic spectrum (Figure 8). While PG&E and SCE compile some of this data into county and city-level presentations, what’s provided is only a snapshot of what’s needed for resilience planning.
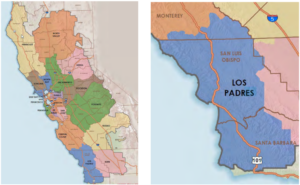
Figure 8. PG&E’s service territory divisions, which are used for annual report reliability metrics, overlaid on top of counties and zoomed into a single division. These reporting divisions are broad, making it difficult to determine the reliability of an individual town or census tract. Image from PG&E’s 2021 Electric Reliability Virtual Town Hall presentation.
Reliability metrics are often reported with and without Major Event Days. These are days when the average outage time exceeds a specific threshold based on the past five years of data. They account for the worst .63 percent of outages. This makes Major Event Days infrequent but highly impactful. Excluding these events allows utilities to separate out routine reliability challenges from the impacts of infrequent disasters. However, major weather events are growing more common due to climate change. And the power outages these events cause are an important focus of resilience planning.
The most granular reliability data included in these annual reports is only given without major event days. Each utility reports a list of their top one percent worst performing circuits (Figure 7) —those circuits that have had the most frequent and the longest outages over the past few years. This equates to 33 circuits for PG&E, 72 for SCE, 10 for SDG&E, three for PacifiCorp, two for Liberty, and one for BVES. It’s a tiny fraction of the circuits on the system, and offers only a partial picture of electric reliability. This means that particularly long outages, including long-duration PSPS events which may have had an outsized impact on those experiencing them, aren’t included.
Current utility metrics also don’t address who is losing power and what this might mean for their daily lives. In some instances, utilities report the number of medical baseline customers impacted by an outage. But that doesn’t tell the whole story of an outage’s potential impact. It also doesn’t help a community piece together its outage risk. For neighborhoods looking to build local resilience—for example, by building a community resilience hub equipped with solar and storage—knowing what size battery system they need and how much funding to apply for is critical. And for state policymakers looking to allocate funding for resilience, knowing which communities are hit hardest and most often should be backed up by easily available data.
An individual can request information from their utility about the circuit that serves their home or business. But knowing exactly what to ask for, who to ask, and what to do with the information once it’s available can be a challenge. Ultimately, the lack of accessible, ready-to-use data can be a barrier to resilience planning, particularly for communities with fewer resources.
Making Communities Across California More Resilient
For resilience planning, we can start by using PSPS outages as a stand-in for power reliability, particularly when defining typical outage durations. We can then try to complete the picture, making it easier for communities to design and build robust local resilience.
Utilities and communities approach reliability from different angles. As regulated businesses, investor-owned utilities are focused on meeting compliance goals and maintaining the system’s overall functionality. On the other hand, communities are living through power outages. They’re interested in reliability for its role in local resilience.
So how can we bridge the gap between utility reliability data and community resilience?
- Call for increased data accessibility. Utilities share outage data in some form, but it may not be easy for all communities to use. Utilities should be required to provide clear, granular data on outages and census-tract or census-block level reliability. This should be true not just for the investor-owned utilities, but also publicly-owned utilities and electric co-ops.
- Center communities and local voices when designing and prioritizing resilience solutions. Members of a community have lived experience of outages in their area—knowledge that isn’t reflected in the data a utility collects. The community knows how outages have harmed them and what they need to weather future emergencies
- This is why PSE is working with the Asian Pacific Environmental Network (APEN) and Communities for a Better Environment (CBE) on building solar and storage community resilience hubs in climate-vulnerable communities.
- Consider a community’s adaptive capacity when it comes to funding. While a community might not be disadvantaged by CalEnviroScreen metrics, electrical outages may still impose a significant burden on its residents. So when funding resilience solutions, consider the following:
- A community’s ability to request, sift through, and analyze their local utility’s data in order to meet the technical requirements of a grant proposal. Offering technical assistance grants prior to project funding may enable under-resourced communities to acquire the funding necessary for resilience projects.
- A community’s capacity to recover from a disaster or emergency event, and the potential long-term implications of repeated outages on members of that community. Funding for resilience projects should consider whether a community is currently low-income or disadvantaged, as well as whether a community is likely to slip towards poverty after experiencing a crisis.
- Conduct research on where to site community resilience hubs. Research should consider how to best support disadvantaged and vulnerable communities, considering local needs and ensuring that hubs are accessible to a significant portion of residents. This means identifying the following:
- Where communities are most at risk, based on cumulative environmental and social burdens as well as their adaptive capacity.
- Regions where it may be difficult to provide resilience through solar and storage; for instance, in areas that don’t receive a lot of sunlight during months with frequent outages.
- Optimal locations for resilience hubs or other resilience solutions in remote, rural regions where populations are spread out.
Acknowledgments
This work is part of PSE Healthy’s community resilience hubs project and is supported by California Strategic Growth Council’s Climate Change Research Program with funds from California Climate Investments, a statewide initiative that puts billions of Cap-and-Trade dollars to work reducing greenhouse gas emissions, strengthening the economy, and improving public health and the environment–particularly in disadvantaged communities.