Patrick Murphy
Senior Scientist
Inconvenient for all, deadly for some
Californians have grown unhappily familiar with the term “Public Safety Power Shutoff.” Residents receiving a PSPS warning brace themselves for power outages that could last days – a prospect triggering annoyance in many and serious, justified anxiety in others.
For the millions of Californians now working and schooling from home, extended power outages disrupt productivity and create significant inconvenience. For individuals who depend on electrically powered medical, mobility, or other essential devices, loss of electricity can be life threatening. Robert Mardis of El Dorado County provides a sad example. He died during a 2019 PSPS event when he was not able to reach his battery powered backup oxygen system in time. Even with backup batteries, many medical devices will not last through a typical PSPS event. This leaves many people scrambling for backup power or a place to stay with more reliable electricity.
PSPS are inconvenient for all and deadly for some. So when, where, and how often will they continue to occur? And what is being done to make them less common, shorter, and less burdensome?
Why do PSPS events happen at all?
Utility companies have been delinquent in power system maintenance that would reduce the chance of sparking fires. U.S. District Judge William Alsup, in charge of PG&E’s criminal probation for utility-caused wildfires in 2010, neatly explained how we arrived at this state of affairs: “Pacific Gas & Electric Company, though the single largest privately-owned utility in America, cannot safely deliver power to California. This failure is upon us because for years, in order to enlarge dividends, bonuses, and political contributions, PG&E cheated on maintenance of its grid—to the point that the grid became unsafe to operate during our annual high winds, so unsafe that the grid itself failed and ignited many catastrophic wildfires.”
Utilities are required to ensure clearance between energized power lines and trees or limbs that might hit the lines. When trees or branches hit power lines, either the branch can cause a short circuit between two lines, or the branch can push lines together to cause a short circuit directly between the lines. In either case, the short can cause the branch to catch fire, or cause sparks or molten metal to drop on and ignite bushes or grass. During dry and windy conditions, this can spark a catastrophe. In 2017, the Wine Country Fires (Atlas, Nuns, and 15 other fires) were caused by such a tree strike and ultimately killed 22 people. The Camp Fire in 2018 killed 85 people and, again, was caused by PG&E mechanical failures and tree strikes from failure to maintain adequate clearances.
Another way tree strikes can occur is when power lines sag into trees. This can happen when lines are overloaded, causing them to overheat, stretch, and expand. The 2003 blackout across the U.S. Northeast and Canada was initiated by such a tree strike. It left 50 million people without power for two to four days, causing $4-10 billion in economic damages. Events like these fires and the Northeast blackout are why PSPS have become common practice. To prevent fires, deaths, and large cascading outages, and to compensate for years of insufficient maintenance, utilities have instituted smaller, more controlled outages.
What are PSPS other than scheduled power outages
PSPS events are basically a temporary fix to a failed system. Lack of maintenance increases wildfire risk and years of deferred maintenance can’t be made up for in a month or even a year. In 2019, PG&E CEO Bill Johnson told the California Public Utilities Commission (CPUC) that maintenance to prevent wildfires would get better every year, but it would be a ten year effort to get PSPS events “ratcheted down significantly.”
PSPS originated in 2012 when the CPUC ruled that electric utilities could shut off power to prevent electrical equipment from sparking wildfires, especially during dry, windy weather. SDG&E had originally requested permission from CPUC to conduct fire-prevention shut-offs in 2008, but the request wasn’t granted until 2012. In 2018, the CPUC extended the PSPS ruling to allow all Investor Owned Utilities (IOUs) in California to have PSPS, along with establishing some requirements for notification and reporting them.
From 2013-2020, California utilities reported cutting power to more than 3.2 million customers (not unique customers — sometimes the same customers get shut off multiple times during different events). PSPS events have accounted for more than nine billion customer outage minutes since 2013 (number of customers in shut-off)*(outage duration in minutes)). This equates to, on average, more than 1 hour and 16 minutes per year for each of the almost 15 million utility customers in California.
While most California utility customers have not experienced PSPS events yet, some have faced numerous outages lasting multiple days each year. The average outage time of 1+ hours is therefore misleading. For those experiencing PSPS shutoffs, the average duration is almost two days, with some outages extending longer than six days. The duration of a PSPS outage is driven by two factors: (1) the duration of the weather event triggering the need to de-energize and (2) the amount of time it takes the utility to determine the event is over and inspect the lines to ensure they can be safely re-energized.
How long are PSPS and how often do they occur?
In Table 1 we summarize the history of PSPS events since 2013. The number of events reported, number of circuits de-energized, number of customers impacted, and the duration of outages have all trended higher over this period.
Events are reported by utilities when their risk analysis indicates they need to shut-down some circuits to prevent sparking fires. The number of circuits de-energized varies for each event, depending on how widespread the weather that is causing the increased risk. Some circuits, especially in densely populated areas, may have thousands of customers. Customers can be businesses or homes, and normally include more than one person impacted per customer.
While there has been a significant increase in the number of events and number of customers impacted since 2013, some of this may simply be from allowing more utilities to have PSPS events, and capturing more data after the 2018 ruling extended PSPS permission and reporting requirements to all IOUs. While SDG&E began reporting in 2013, PG&E and SCE first reported PSPS in 2018, with SCE’s first actual shut-off occurring in January 2019. PacifiCorp only started reporting in 2020. As PacificCorp accounts for less than 1% of California customers, this has not had a significant impact on the overall numbers.
By 2018, utilities serving 82% of California’s customers were reporting PSPS events to the CPUC; as such, any deeper analysis should start there. Since 2018, the number of events has continued to increase. The number of circuits de-energized and the number of customers impacted has been more volatile, with a peak in 2019, driven in large part by the memorable events of October 2019, when more than 2 million customers (1.7 million in PG&E territory) experienced PSPS outages. October 2019’s PSPS event occurred as multiple wildfires already raged (Caples in El Dorado, Kincade in Sonoma County, Saddle Ridge, and Tick in Los Angeles) and the preceding hot dry conditions that helped ignite and spread them continued. In addition, weather reports predicted winds exceeding 80 mph. As a result, the average and maximum outage durations in 2019 were also longer than other years because of the severity and length of the October 2019 events. Given the sheer number of customers impacted, this heavily weights all the statistics.
The average PSPS outage duration across both the 2013-2020 and the 2018-2020 periods was 41 hours (1.7 days). The longest recorded PSPS outage duration reported was 162.8 hours (6.75 days). The October 2019 events account for nearly half (47%) of the nine billion customer outage minutes recorded between 2013-2020 and according to Michael Wara of the Stanford Woods Institute for the Environment, the economic cost of these shut-offs in just one month of 2019 could approach $2.5 billion. That indicates that the total cost of reported PSPS outages from 2013-2020 could be $5.3 billion, or approximately $0.58 per customer outage minute.
For the years with the three largest utilities reporting, we see an average of 14 PSPS events per year and more than one million customers impacted per year.
Table 1: PSPS Statistics by Year
| Year | PSPS Events | Circuits Impacted | Customers Impacted | Average Outage Duration (Hours) |
Maximum Outage Duration (Hours) |
Utilities Reporting |
| 2013 | 1 | 5 | 183 | 7.0 | 8.9 | SDG&E |
| 2014 | 3 | 10 | 1,367 | 15.8 | 32.3 | SDG&E |
| 2015* | 0 | 0 | 0 | 0 | 0 | None |
| 2016** | 0 | 0 | 0 | 0 | 0 | None |
| 2017 | 5 | 66 | 20,820 | 36.1 | 144.9 | SDG&E |
| 2018 | 7 | 91 | 84,565 | 37.6 | 93.7 | PG&E, SCE, SDG&E |
| 2019 | 15 | 2,290 | 2,230,459 | 45.9 | 162.8 | PG&E, SCE, SDG&E |
| 2020 | 20 | 1,168 | 862,475 | 32.2 | 133.8 | PacifiCorp, PG&E, SCE, SDG&E |
| Total | 51 | 3,630 | 3,199,869 | 41.0*** | 162.8 | PacifiCorp, PG&E, SCE, SDG&E |
*2015 and 2016, only SDG&E had permission to execute PSPS, and had none to report.
**2015 and 2016, only SDG&E had permission to execute PSPS, and had none to report.
***Because 2019 had so many more customers impacted, it dominates the Average Outage Duration.
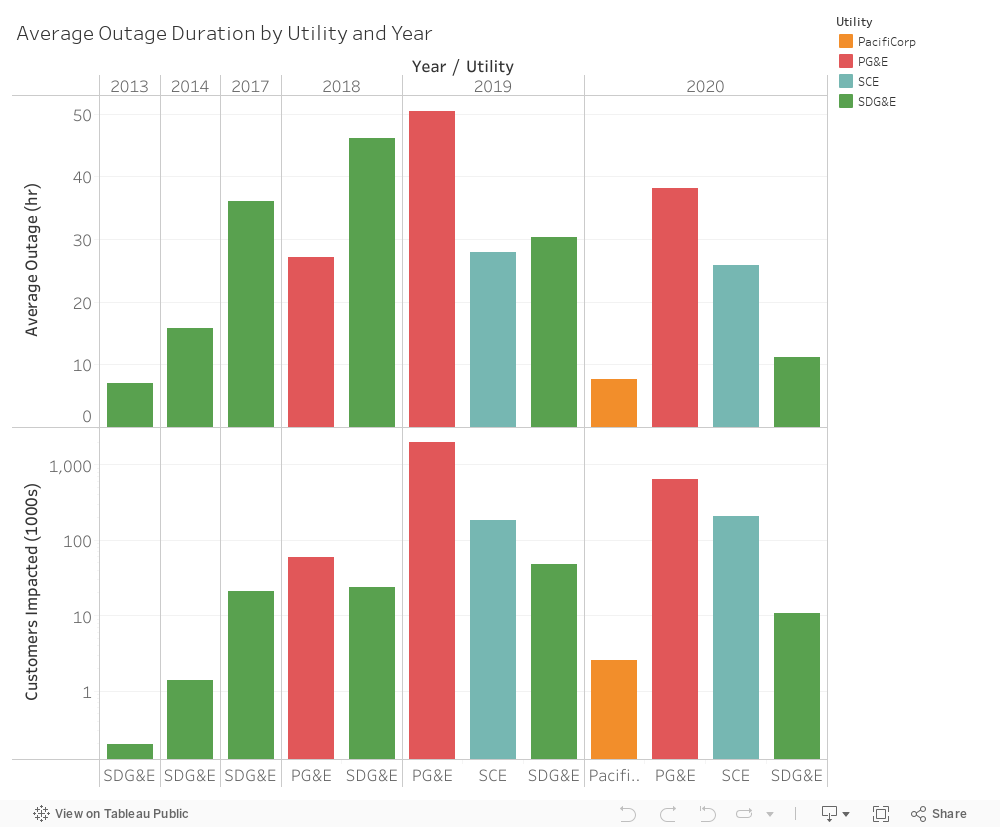
There are some notable differences in numbers of customers impacted and outage durations between the various utilities, as shown in Table 2. The data show that PG&E customers experience more outages (6-8 times more per customer than in other utilities) and longer average outage durations (1.5 times longer) than the other large utilities (SDG&E and SCE). PG&E’s impacted customer counts dwarf the other utilities’ counts, such that reporting from SDG&E before 2017 doesn’t even show up at the scale needed for PG&E unless we use a logarithmic scale, as is shown in the lower half of Figure 1. We use a logarithmic scale when the data range is large; rather than having each increment increase by an equal amount (say by 10 outage hours as in the upper graph), each increment is ten times larger than the last, as is used in the lower graph (1,10,100, 1,000 Customers Impacted). Once again, this is only three years of data with statistics driven by October 2019; while PG&E has had the largest number of customers impacted and the longest outage at 6.8 days, SDG&E has also had an outage lasting longer than 6 days. While PG&E has the worst record, the PSPS problem goes beyond PG&E.
Some of the utilities have done more about the issue. SDG&E has invested significantly to put transmission and distribution lines underground to protect them from wind and tree strikes. Undergrounding and other additional wildfire prevention and mitigation measures are the biggest drivers for costs in SDG&E being 50%-100% higher per kWh than other utilities. The investment may be paying off, as SDG&E’s PSPS durations have been on a downward trend since their peak at 46 hours in 2018 to an average duration in 2020 of less than half a day (see Figure 1, and subsequent analysis on “Outage Duration” below).
Table 2: Utility Comparisons
| Utility | # Customers Served (Thousands) * |
% Cust. Served (% of all CA Customers) |
# Cust. w/ PSPS Outages 2013-2020 (Thousands) ** |
% Cust. w/ PSPS Outages 2013-2020 *** |
Average PSPS Duration (Hours) |
| PacifiCorp | 47 | 0.003 | 2.6 | 0.06 | 7.7 |
| PG&E | 5,590 | 0.38 | 2,701 | 0.48 | 46.8 |
| SCE | 5,150 | 0.35 | 391 | 0.08 | 26.6 |
| SDG&E | 1,480 | 0.10 | 106 | 0.07 | 30.2 |
| Others | 2,490 | 0.17 | 0 | 0 | 0.0 |
| Total | 14,757 | 100 | 3,201 | 22 | 41.0 |
* Energy Information Agency “Annual Electric Power Industry Report, Form EIA-861 detailed data files,” (2019) https://www.eia.gov/electricity/data/eia861/
** Not unique customers; many experience multiple outages, while others none.
*** Not unique customers; many experience multiple outages, while others none.
Where are PSPS events happening?
PG&E territory suffers more outages, as shown in Figure 2, but that’s also in part because PG&E has a bigger PSPS challenge than the other utilities — it covers more area total, and also covers more area in Tier 2 and Tier 3 High Fire-Threat District (HFTD) zones.
![]()
Figure 2: Tier 2 (“Elevated” in yellow) and Tier 3 (“Extreme” in red) High Fire-Threat District (HFTD) zones.20 PG&E – Orange border; SDG&E – Red border; SCE – Green.
PSPS events are typically centered in Tier 2 and Tier 3 High Fire-Threat District (HFTD) zones, but many include neighboring regions, and in some cases include regions completely outside of Tier 2 and Tier 3. An interactive map of HFTD zones is available at https://ia.cpuc.ca.gov/firemap/ for those interested in exploring in more detail.
Utility reporting to date identifies how many customers are impacted by de-energizing certain equipment, and whether those customers are in Tier 2, Tier 3, and/or outside of an HFTD tier. As service areas are not the same as tier boundaries, many times the identification of HFTD tier is “Tier 2, Tier 3 and Outside,” making analysis of PSPS impacts and HFTD zones interaction somewhat challenging. As you can see in Figure 3, only about 5% of PSPS outages occur completely outside of HFTD tiers. Just over a quarter (27%) occur only in PSPS Tiers, with most of that (19%) impacting both Tier 2 and Tier 3 simultaneously. Given that Tier 2 surrounds Tier 3, it is not surprising that only 2% of outages include Tier 3 and areas outside of Tier 3 but not Tier 2. The vast majority of PSPS outages impact Tier 2, Tier 3 and areas Outside of HFTD tiers — 68% of them.
Bottom line, living or working in or near an HFTD zone is a good indicator that PSPS outages will impact you or your business, and as Figure 3 shows, most of California and almost all major population centers are in or near an HFTD zone.
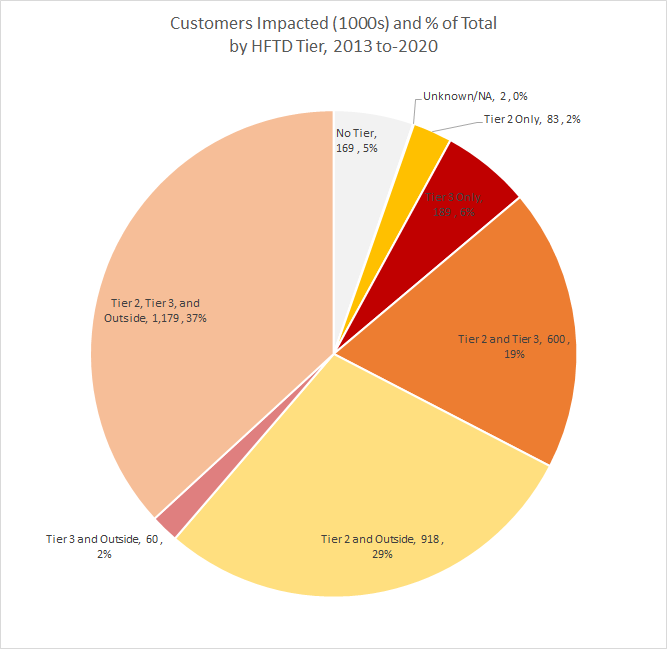
Figure 3: Distribution of outages across HFDT Tiers (Thousands of Customers, percent of total)
What happens next?
Frequency of Events
While utilities try to catch up on maintenance, weather and climate forecasts that impact PSPS events are likely to become more common and more severe. A recent U.S. EPA report explains that: “Wildfires, a longstanding and frequent threat to California, are expected to increase in intensity and frequency due to climate change,” and “fire season now starts earlier, and ends later.”
Because fire risk drives PSPS events, their overall frequency and the geographic area they impact are likely to increase. Four meteorological variables affect the length and severity of fire season:
- maximum temperatures,
- minimum relative humidity,
- the number of rain-free days, and
- maximum wind speeds.
Figure 4 shows California’s annual maximum temperature (top graph) has risen by 2 degrees Fahrenheit in the last century and continues to rise. Higher maximum temperatures will continue to generate more fire risks and likely trigger more PSPS events. However, climate change isn’t just about hotter temperatures.
Humidity and rain-free days both correlate with drought and the Palmer Drought Severity Index (PDSI) in the lower graph of Figure 4 estimates relative soil moisture conditions over the last century. PDSI of less than 0 indicate dryer than normal conditions. The trend toward more drought years (more yellow bars) and more severe drought conditions (longer yellow bars) is clear. Also, don’t let the cartoonish nature of Figure 5 mislead you—it is a powerful representation of increasing drought severity in California from 2000-2014. Figure 6, which is the focus of the next section, also shows a downward trend in relative humidity consistent with PDSI. Thus, both meteorological variables two and three are trending toward more fires and PSPS events.


Figure 5: Using California as the vertical axis, Randall Munroe of webcomic xkcd.com compiled drought data from the U.S. Drought Monitor to plot drought levels over time in CA.
The last, but not least important meteorological variable is wind. The strength and duration of high wind events directly impacts the frequency and duration of PSPS events. California’s most destructive wildfires have been linked to the occurrences of Diablo Winds (DWs), and data from four Remote Access Weather Stations (RAWS) and two other wind data sources shown in Figure 6 demonstrate obvious trends since 1980: an increasing number of Diablo Wind events over time, increasing wind speeds, and an increasing number of hours per year with Diablo Winds.

Figure 6: Time series of the a) total number of DWs per year (September–December), b) total hours/durations of DWs per year, c) the associated maximum wind speeds (m s−1), and d) the associated minimum relative humidity (%) from NARR (red lines), ERA5 (blue lines), and RAWS (black lines).
Expansion of Fire and PSPS Seasons
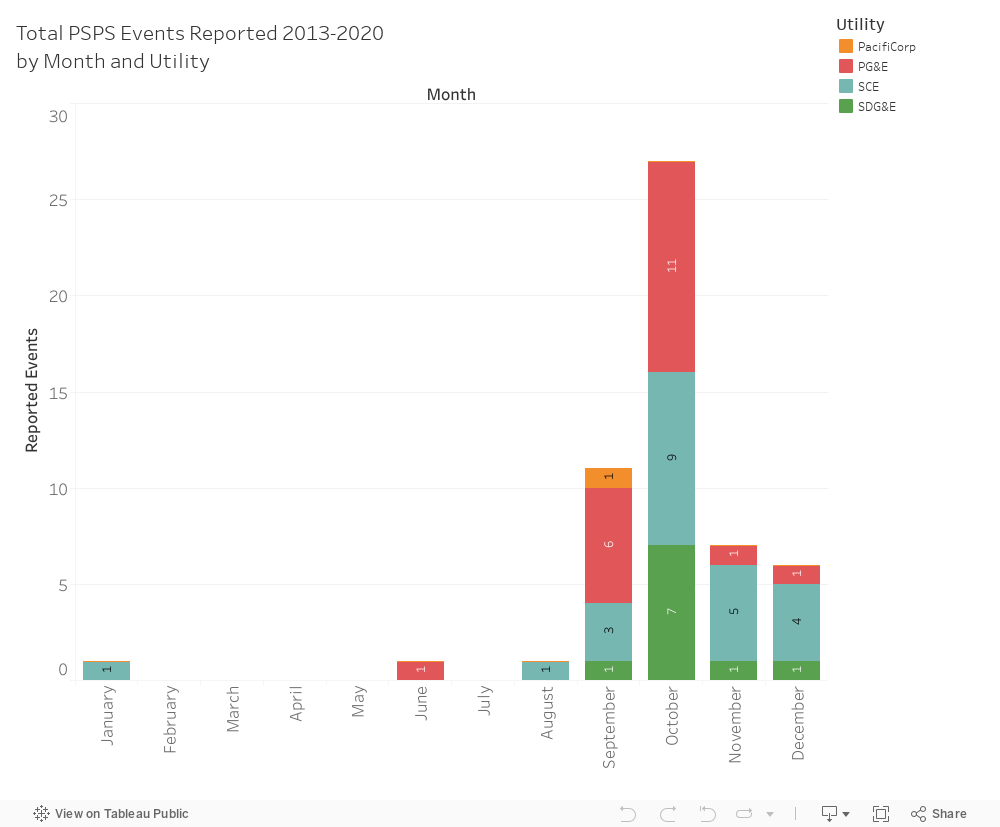
Most PSPS impacts have occurred late summer through early winter, with a peak in October (Figure 7). Research on climate-induced variation in fire seasons worldwide between 1979 and 2013 shows that “fire weather season length and long fire weather season affected area increased significantly across all continents except Australia.” In the years after this report, Australia has joined the trend, experiencing more dangerous fire conditions, including its hottest year on record (2019), an increased frequency of fires, an earlier start to fire season, and in 2019 and 2020, two of the worst fire seasons ever recorded. As fire season expands in California, we can expect more fires and more PSPS events across more months of the year.
Outage Durations
How long do and will PSPS events last? Historically, PSPS events last on average just under two days, with a maximum duration observed so far of just under a week, but with some differences across years and utilities. For those who want to continue with a bit of a deep dive into statistics, continue on; for those who want to avoid stats, jump ahead to “Location of events.”
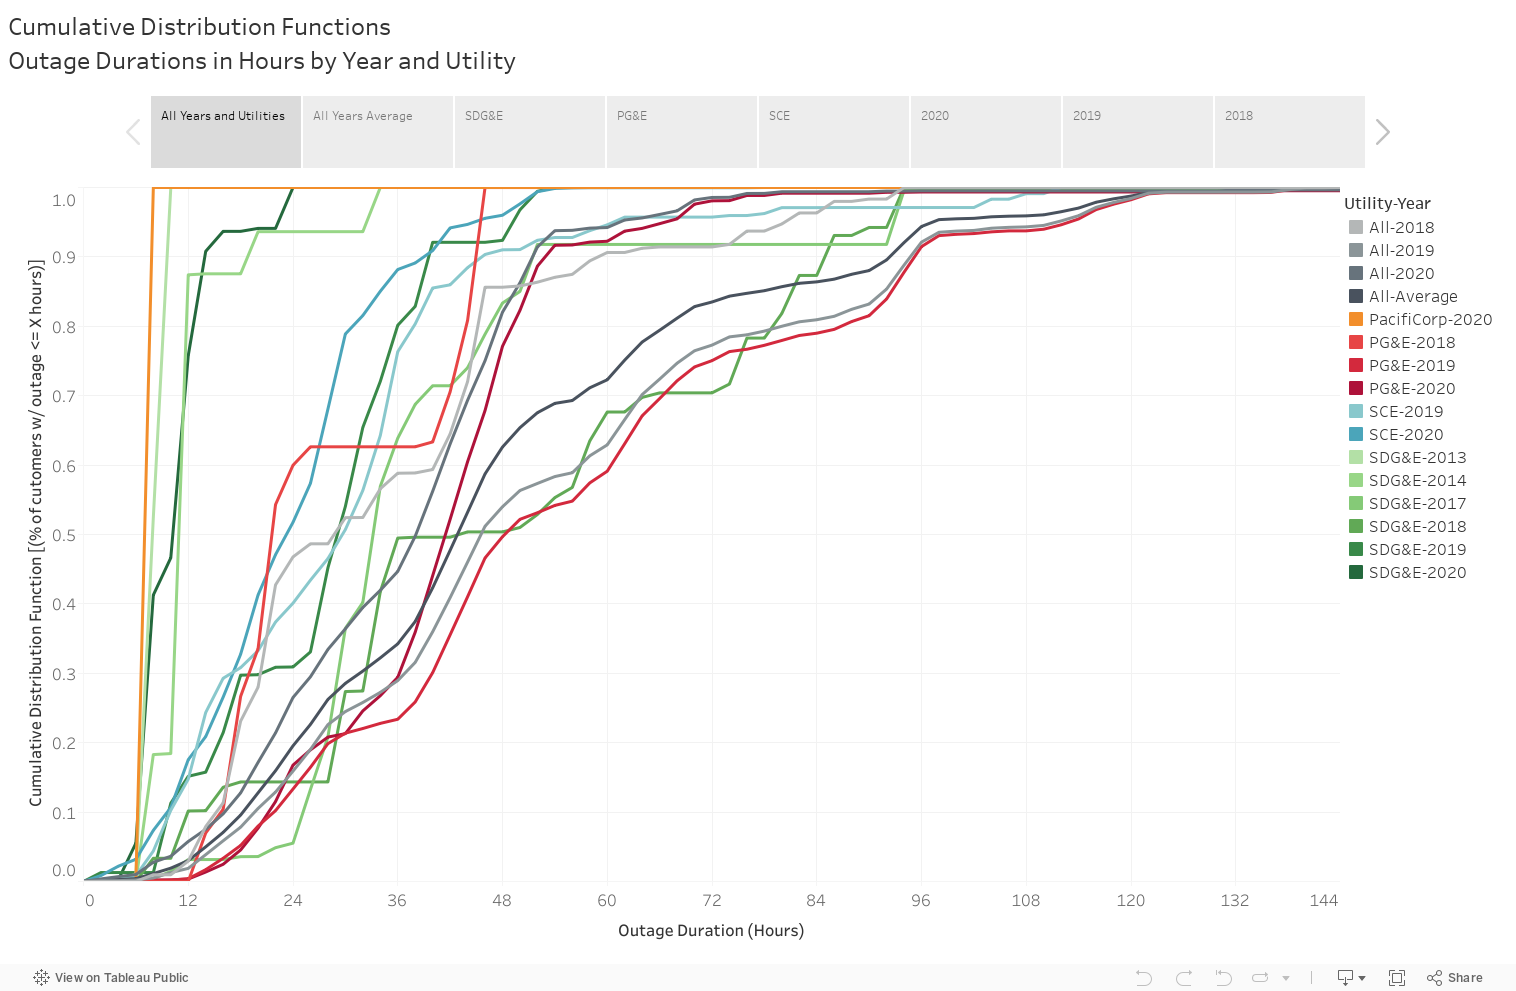
Figure 9 presents a somewhat more complete, and thus more complicated, view of PSPS outage durations. Each utility has its own color, with the trace becoming darker in more recent years. The grey series shows the average Cumulative Distribution Function (CDF) per year, weighted by number of customers impacted in that year for each utility. Finally, the average across all utilities and years is shown in the darkest grey trace.
First, for non-statisticians who still chose this path, a Cumulative Distribution Function describes the probability that a variable (Outage Durations, in this case) will have values less than or equal to the X axis value. For a very simple example, see PacifiCorp in 2020 (in orange). PacifiCorp reported one incident in 2020, with all outages lasting more than 6 hours and less than 8 hours. The CDF for PacifiCorp in 2020 equals zero until the sixth hour, ramps quickly up to 1 by hour eight. For PG&E in 2019 (the furthest right right, in red), we can see that half of the outages lasted longer than 48 hours (where the line crosses the 0.5 on the Y-axis) and that more than 10% of outages lasted longer than 94 hours (where the line crosses the 0.9 on the Y-axis). When the CDF trace is flat for extended periods, that indicates long periods when no power was restored, as can be seen in PG&E’s 2018 data between hours 26 and 38. Similarly, steep sections of the CDF indicate many customers being re-energized, either with many circuits getting turned back on, or large circuits impacting many customers. PG&E’s 2018 data between hours 40 and 46 is a good example of this, as almost 40% of the outages were restored in this 6-hour period.
Scanning all years and utilities, the median outage durations (0.5 on the Y-axis) range from 6 hours to almost 2 days, with the overall median hitting at 42-44 hours.
- Focusing on SDG&E (select “SDG&E” in the story line) for a moment, we see that 2013 had short outages, akin to PacifiCorp, but 2018 had longer outages, much like PG&E’s 2019. As was shown in Figure 1, SDGE’s average outage was less than half a day in 2013, grew to almost 3 days in 2018, and then returned to less than half a day by 2020.
- PG&E’s best reported year was 2018(now select “PG&E” in the story line) , with all customers restored within 2 days; their worst year was 2019, when some customers were without power for almost a week, and half its customers were out for at least 2 days. PG&E’s 2020 data falls right back between 2018 and 2019.
- SCE reported outages in 2019 and 2020, with average duration in both years being relatively consistent. Note though, that in 2019 you can see that about 8 percent of customers had longer outages than any SCE customer outages in 2020, with 3 percent of customers not being re-energized for more than 4 days.
Finally, averaging across all utilities and years provides the best estimate for future events (select “All Years Average”). Given the small sample size, and without diving into detailed local analysis for utility companies, specific circuits, wind regimes, drought predictions, etc., it would be unwise to predict SDG&E or SCE will continue to have shorter outages. In all likelihood, some years will be worse in Southern California, some will be worse in the Sierras, and PG&E will continue to have the most customers impacted. With climate impacts increasing, and utilities trying to catch up on grid maintenance, it is difficult to predict how many PSPS events will occur, and how long they might last. Even so, it would be unwise to ignore the data we have that shows outages averaging 2 days, and sometimes exceeding 6 days. If history holds, we can expect that in future outages:
- Half will last less than 44 hours (1.8 days)
- 75% will last less than 62 hours (2.6 days)
- 90% will last less than 92 hours (3.8 days)
- 95% will last less than 98 hours (4.1 days)
- 99% will last less than 120 hours (5 days)
Depending on the impact of outages for various customers, they should plan for outage durations accordingly. Someone who depends on electricity for a life-saving medical device should be prepared to have backup power for that device, or an escape plan to a non-PSPS impacted area for at least 5 days. Critical infrastructure dependent on electricity, like water treatment plants, should be similarly prepared.
Customers not so vulnerable to power outages, but obviously inconvenienced by them, should consider the cost of solar, battery, or other distributed generation that helps them move toward self reliance within their budget, given these expectations.
Location of Events
People and businesses in or near HFTD Tier 2 and Tier 3 zones, especially those who have already experienced PSPS shut offs, should be prepared to endure outages that last from two days to almost a week and should expect several of these events per year for the next ten years.
Net Impact
Utilities will endeavor to catch up on deferred maintenance and adapt to increasing fire danger. Climate change will continue to drive extreme weather that increases fire danger and triggers PSPS events. The end result for the frequency and duration of PSPS outages is yet to be seen and difficult to predict — other than that PSPS outages will continue to plague California for the foreseeable future.
What to do about PSPS?
| Actor | Recommended Action |
| Policy Makers and Enforcers |
|
| Utilities |
|
| Community Organizations |
|
| Critical Infrastructure Operators |
|
| Individuals and families |
|
| Researchers |
|