Summary
This updated Pennsylvania Oil and Gas Waste Mapping Tool includes interactive visualizations that show waste generation and waste management from oil and gas development in Pennsylvania as reported to the Pennsylvania Department of Environmental Protection (PADEP). Data presented in the interactive visualizations below are presented by PA counties, and PA State House and Senate Districts, current as of September 2022. PA Districts will be updated after the 2022 election. Click below to view oil and gas waste generation and waste management by county, PA State House and PA State Senate Districts from 2015 through 2021. This tool was developed with support from the Climate and Clean Energy Equity Fund.
Quick Tips
- For a deeper view of specific maps or data: Select individual tabs
- To explore connected visualizations: Select dashboard view.
- For a full-screen visualization: Click on the full-screen icon at the bottom right corner of a tab.

- To download images or data from an individual plot or map: Click on the download icon at the bottom right of that figure.

- To undo all filters: Click on the revert icon at the bottom right corner of a tab.

- To embed or share a link to a specific map view: Click the connections icon on the bottom right of your map results.

- To re-center maps: Click on the home icon, which appears when you hover in the top left corner.

- Use the glossary to look up terminology: The Glossary and Sources page includes definitions and data sources
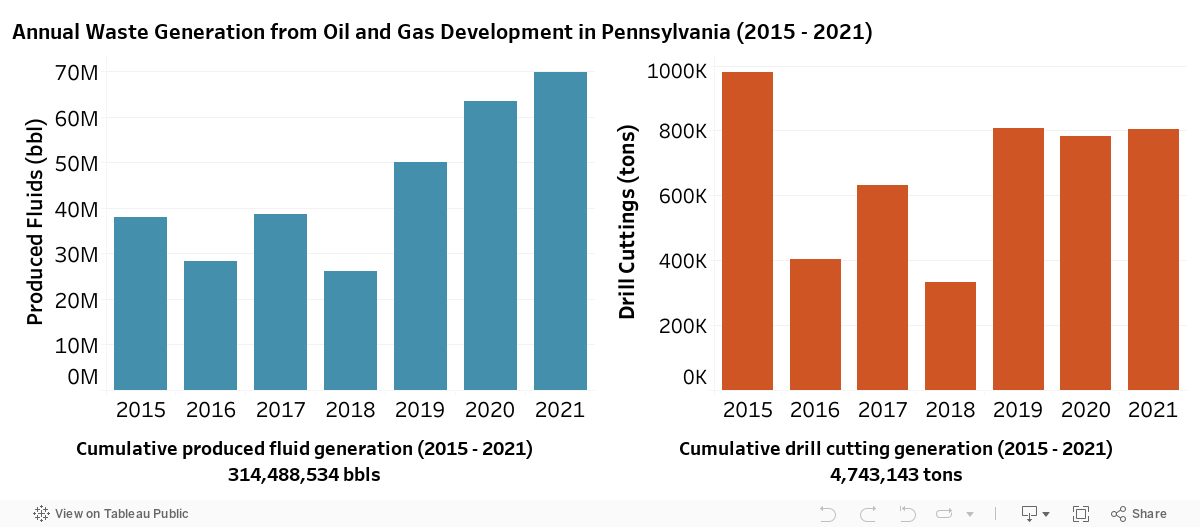
Annual Oil and Gas Waste Generation (2015 – 2021)
Explore wastewater and solid waste generated by oil and gas development in Pennsylvania from 2015 through 2021. Hover over visualizations to see total annual waste volumes. Wastewater volumes shown are limited to produced fluids and reported in barrels (bbl) and solid waste (drill cuttings) are reported in tons. Briefly, produced fluids are wastewater co-produced from the well during oil and gas production. Drill cuttings are the primary form of solid waste from oil and gas development in Pennsylvania and stem from the drilling of new wells.
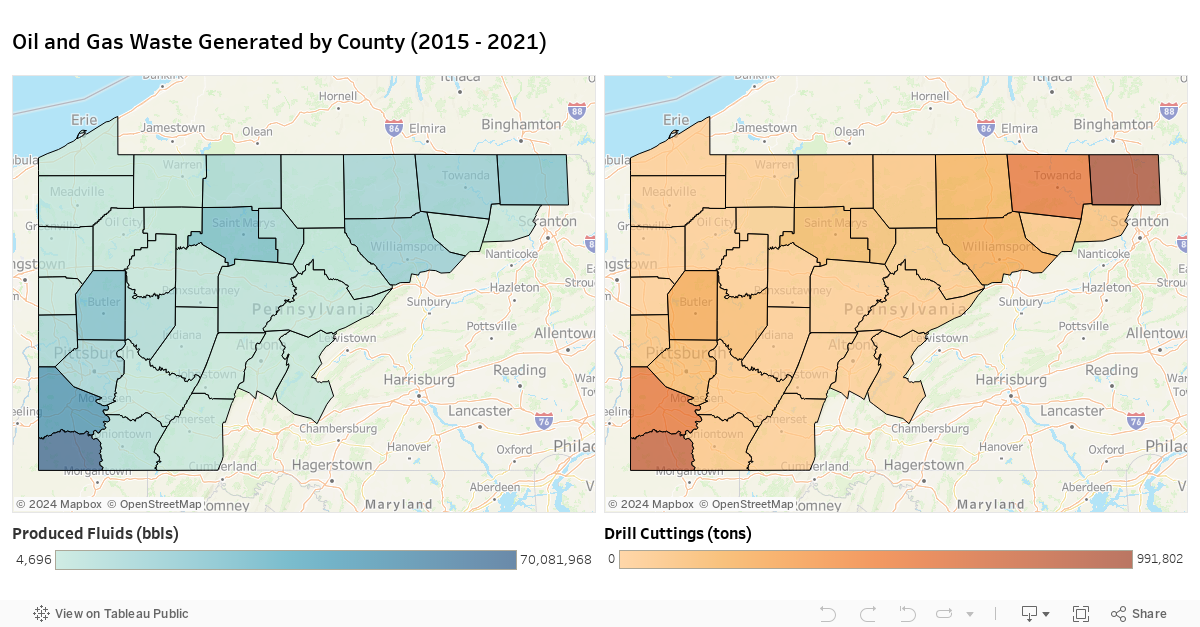
Oil and Gas Waste Generation and Waste Management by PA County (2015-2021)
Explore wastewater (produced fluids) and solid waste generated by oil and gas development in Pennsylvania counties from 2015 through 2021. Hover over visualizations to see total annual waste volumes or quantities and the number of wells responsible for generating waste (2015 – 2021).
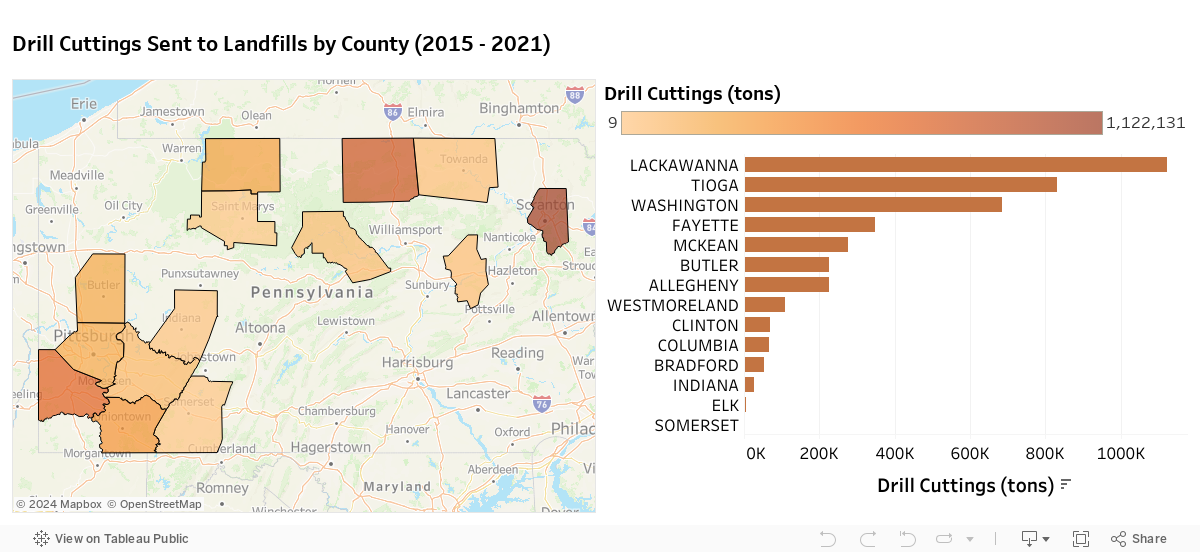
Drill cuttings from oil and gas development are primarily sent to landfills for disposal. Explore quantities of drill cuttings from Pennsylvania oil and gas development sent to landfills across PA counties between 2015 and 2021. Notes: Interactive data visualizations regarding oil and gas waste management primarily focus on solid waste sent to landfills and do not include how wastewater is managed. This is largely due to data availability from 2015-2021, as records reporting solid waste from oil and gas development were twice as likely to have spatial information included as compared to records reporting wastewater volumes. Nearly all (>99%) of waste records with drill cutting quantities reported include latitude and longitude allowing waste to be tracked to its next destination, whereas only 45% of waste records with produced fluid volumes had available spatial information. These differences in the availability of spatial information regarding waste management between liquid and solid waste are also noted in Hill et al., 2019 for the years of data examined.
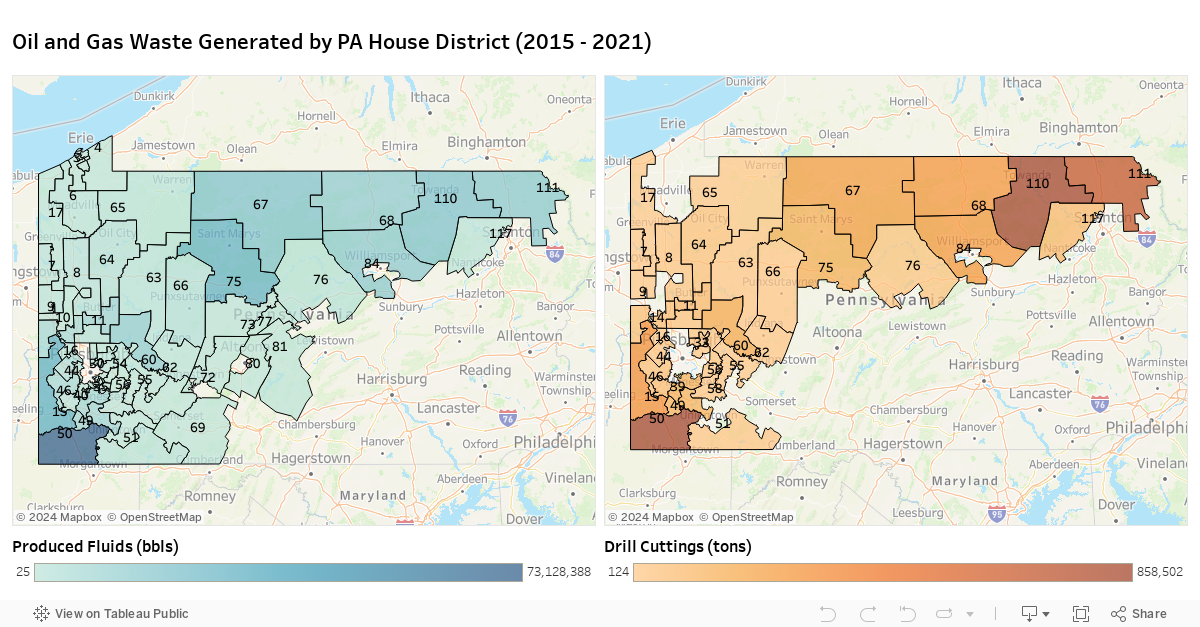
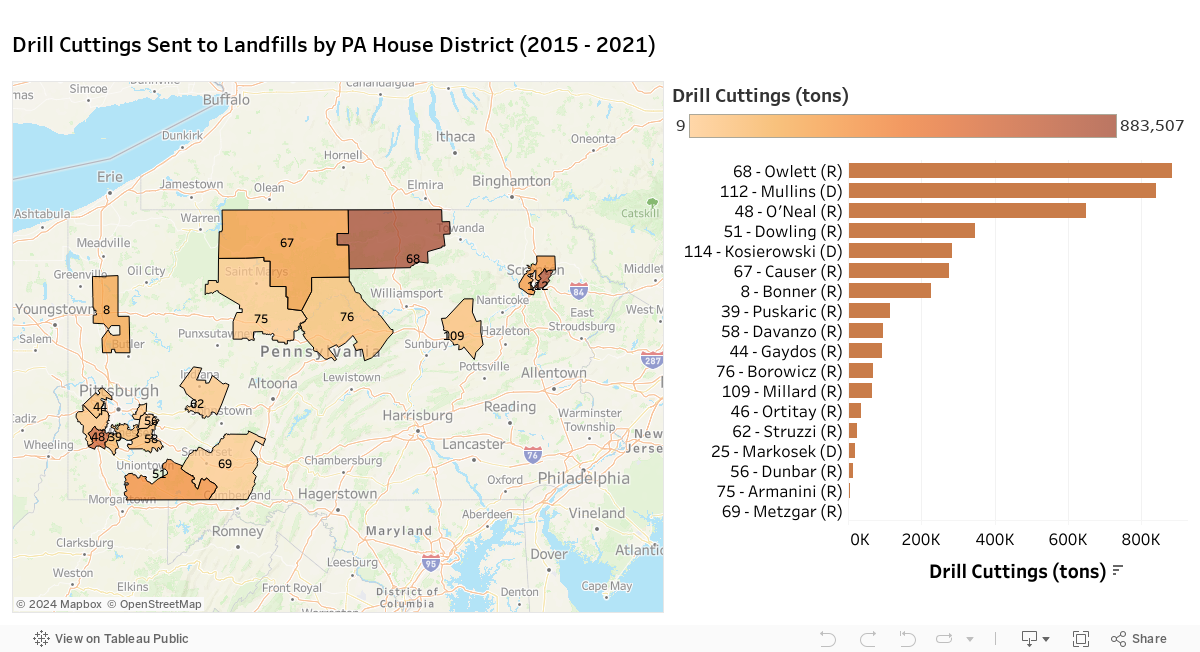
Oil and Gas Waste Generation and Waste Management by PA House District (2015-2021)
Explore wastewater (produced fluids) and solid waste generated by oil and gas development in Pennsylvania State House Districts from 2015 through 2021. Hover over visualizations to see total annual waste volumes or quantities and the number of wells responsible for generating waste (2015 – 2021). Note: Data presented in the interactive visualizations below are presented by Pennsylvania State House Districts, current as of September 2022. PA House Districts will be updated after the 2022 election.
Drill cuttings from oil and gas development are primarily sent to landfills for disposal. Explore quantities of drill cuttings from Pennsylvania oil and gas development sent to landfills across PA House Districts between 2015 and 2021. Notes: Data presented in the interactive visualizations below are presented by Pennsylvania State House Districts, current as of September 2022. PA House Districts will be updated after the 2022 election. Interactive data visualizations regarding oil and gas waste management primarily focus on solid waste sent to landfills and do not include how wastewater is managed. This is largely due to data availability from 2015-2021, as records reporting solid waste from oil and gas development were twice as likely to have spatial information included as compared to records reporting wastewater volumes. Nearly all (>99%) of waste records with drill cutting quantities reported include latitude and longitude allowing waste to be tracked to its next destination, whereas only 45% of waste records with produced fluid volumes had available spatial information. These differences in the availability of spatial information regarding waste management between liquid and solid waste are also noted in Hill et al., 2019 for the years of data examined.
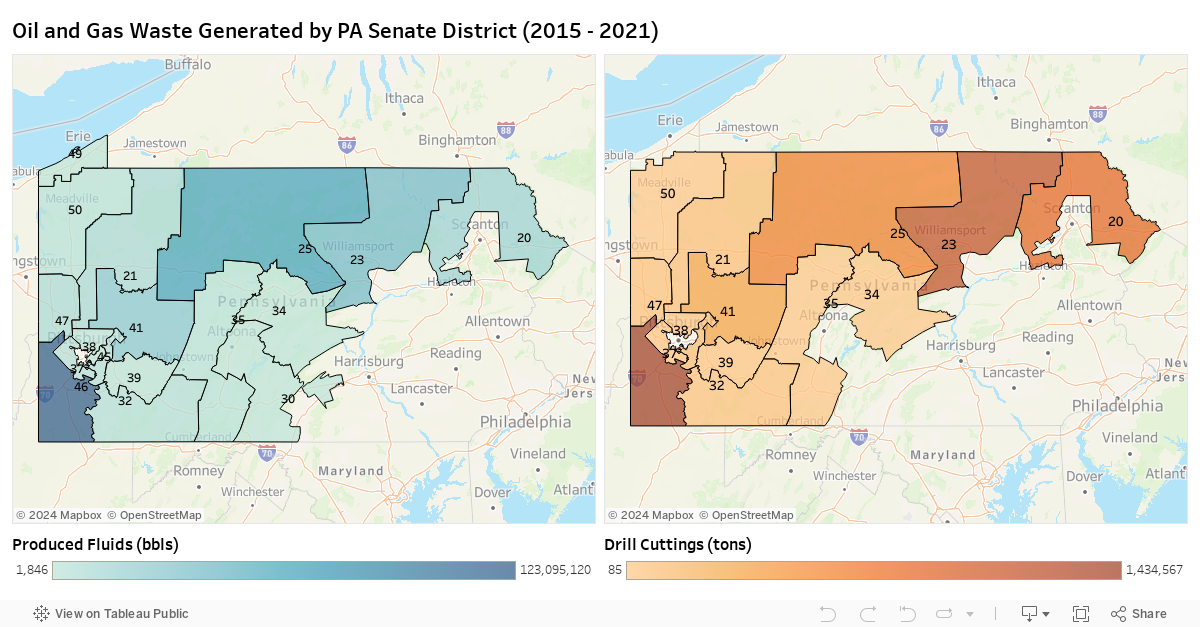
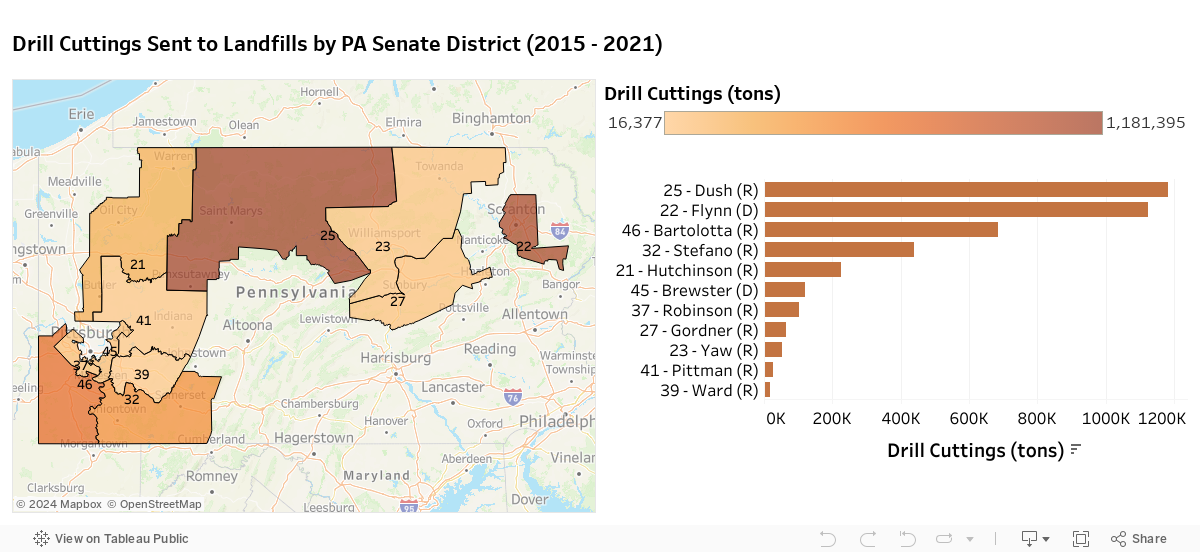
Oil and Gas Waste Generation and Waste Management by PA Senate District (2015-2021)
Explore wastewater (produced fluids) and solid waste generated by oil and gas development in Pennsylvania PA State Senate Districts from 2015 through 2021. Hover over visualizations to see total annual waste volumes or quantities and the number of wells responsible for generating waste (2015 – 2021). Wastewater is limited to produced fluids and reported in barrels (bbl) and solid waste (drill cuttings) are reported in tons. Briefly, produced fluids are wastewater co-produced from the well during oil and gas production. Drill cuttings are the primary form of solid waste from oil and gas development in Pennsylvania and stem from the drilling of new wells. Note: Data presented in the interactive visualizations below are presented by Pennsylvania State Senate Districts, current as of September 2022. PA Senate Districts will be updated after the 2022 election.
Drill cuttings from oil and gas development are primarily sent to landfills for disposal. Explore quantities of drill cuttings from Pennsylvania oil and gas development sent to landfills across PA Senate Districts between 2015 and 2021. Note: Data presented in the interactive visualizations below are presented by Pennsylvania State Senate Districts, current as of September 2022. PA Senate Districts will be updated after the 2022 election. Interactive data visualizations regarding oil and gas waste management primarily focus on solid waste sent to landfills and do not include how wastewater is managed. This is largely due to data availability from 2015-2021, as records reporting solid waste from oil and gas development were twice as likely to have spatial information included as compared to records reporting wastewater volumes. Nearly all (>99%) of waste records with drill cutting quantities reported include latitude and longitude allowing waste to be tracked to its next destination, whereas only 45% of waste records with produced fluid volumes had available spatial information. These differences in the availability of spatial information regarding waste management between liquid and solid waste are also noted in Hill et al., 2019 for the years of data examined.
@PhySciEng
Energy costs are a persistent burden for low-income communities. Recent research from @PhySciEng @IEERArjun on behalf of @COEnergyOffice offers a suite of strategies to align affordability, equity, #publichealth, and #climate goals.
https://www.psehealthyenergy.org/our-work/publications/archive/…
Stay informed!
Join our email list to receive updates
on PSE’s work and news.