Background
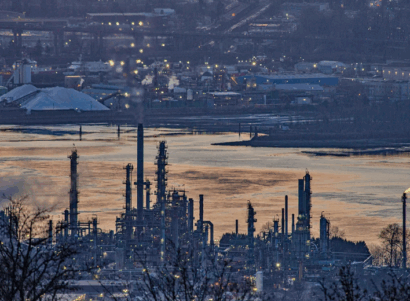
Methane emissions from oil and gas infrastructure have long been recognized as a significant climate concern due to methane’s heat-trapping power. But the climate impact is only part of the story: these same emissions are also an air quality and public health concern. Research from PSE has revealed that when methane is released, hazardous air pollutants (HAPs) like benzene are also emitted by its side. Specifically, in our recent paper examining seven methane emissions events, we found that all of them co-emitted benzene at levels that may pose health risks to nearby communities.
Since that publication, we have launched the Methane Risk Map (MRM), an interactive digital tool that displays air concentrations of HAPs co-released during methane emissions events. With the release of the MRM, we’ve expanded our case study dataset to 1,423 events across 13 states spanning from 2016 to 2025. This number will only grow as we continuously add new cases to the tool.
In this article, we extend our findings from those initial seven cases to reveal key insights from these broader 1,423 methane emissions events. Here is what we’ll cover:
- The problem is widespread: The key findings of our seven-case paper hold up across this much broader dataset.
- The health risks vary by location: We break down risks by state and basin to provide key data for stakeholders and residents.
- New data reveals new findings: With the expanded dataset, we can now present updated statistical measures that weren’t visible in our initial study.
For more comprehensive information about the MRM and its underlying methods, see these essential resources:
- Rowland et al. 2025: Explains the database and methods used to estimate the chemical composition of methane emissions events.
- Bisogno et al. 2025: Describes the modeling and statistical methods underlying all the events on the MRM.
- MRM Product Guide: Gives a high-level overview of the MRM, its methods, and its products.
Analysis Methods
Lower- and Upper-Bound Analyses
Cases on the MRM have three options for Gas Type depending on the equipment associated with the emissions event:
- Nonflash: Direct release of natural gas into the atmosphere.
- Flash: Gas releases that occur due to rapid temperature or pressure changes within a storage tank, causing liquid to “flash” into the gas phase.
- Unknown: When available information is not sufficient to confidently determine whether the gas type is flash or nonflash.
Why This Matters for Health Risk Estimates
Our team (Rowland et al. 2025) discovered that flash gas contains significantly higher levels of HAPs per unit methane than nonflash gas. This means that flash gas events generally have higher HAP emissions and pose greater health risks.
How We Handle Unknown Gas Type Cases
Because flash and nonflash emissions have different health implications, we model Unknown cases twice, as both flash and nonflash, to establish a realistic range:
- Upper-Bound Analysis: Treats Unknown cases as flash (uses higher HAP emissions).
- Lower-Bound Analysis: Treats Unknown cases as nonflash (uses lower HAP emissions).
Together, these Lower- and Upper-Bound analyses provide a realistic range of values for the analysis metrics shown below.
Analysis Metrics
The following metrics were used in this analysis:
- Peak Concentrations: The 98th percentile 1-hour average concentrations at each location across the modeled time window.
- Health Risk Benchmark: The 1-hour benzene benchmark (8 ppb) set by California’s Office of Environmental Health Assessment.
- Risk Area: The area (sq mi) where modeled benzene peak concentrations exceed 8 ppb.
- Combined Risk Area: The total area for all 1,423 cases where modeled peak concentrations exceed 8 ppb. Overlapping areas are combined to ensure no double-counting occurs.
- Population at Risk: The number of people who live within the combined risk area. The use of the Combined Risk Area ensures no double-counting occurs.
- Sensitive Facilities at Risk: The number of sensitive facilities (schools, childcare centers, hospitals, nursing homes, and prisons) within the Combined Risk Area. The use of the Combined Risk Area ensures no sensitive facilities are double-counted.
Results: Health Risks from Methane Emissions Events
All results presented are current as of 02/06/2026.
MRM Results for All 1,423 Cases
The numbers represent the Lower and Upper Bounds:
- Percent of Cases with a Benzene Exceedance: 99.6 – 99.7%
- Combined Risk Area: 1,853 – 5,713 sq mi
- Population at Risk: 51,839 – 120,283
- Sensitive Facilities at Risk: 53 – 90
These key findings support our previous publication (Bisogno et al. 2025), showing that almost all (99.6-99.7%) methane emissions events from oil and gas infrastructure potentially put nearby communities and sensitive facilities at risk.
MRM Results by State
For state results, if a modeled event has a risk area extending into a neighboring state, we count all people within the risk boundary, regardless of which state they live in. For example, if an event originates in New Mexico but the risk area extends into Texas, we include affected Texas residents in the population count for that New Mexico event.

MRM Results by Basin
We follow the same methods for the U.S. Oil and Gas geologic basins as outlined above for the states.

Analysis Limitations
The above analysis has three major limitations that suggest our results likely underestimate the true health impacts of methane emissions events:
- Limited Observations: Detections rely on polar-orbiting satellites and targeted aircraft campaigns. Satellites rely on chance overpasses during an active emissions event to detect it, while aircraft campaigns are limited to specific geographic areas. Therefore, many emissions events are likely missed.
- Upstream Sector Only: Currently, the MRM only models upstream (exploration and extraction) oil and gas events. We do not include midstream (processing and transportation) or downstream (refining and distribution) events.
- Lack of Gas Composition Data: We cannot model events from oil and gas basins not included in our gas composition database, events without state regulatory emission estimates, or events with no visible infrastructure or conflicting infrastructure within 10 meters (which lack the information needed to assign a gas type).
Due to these limitations, the numbers presented represent a conservative underestimate of methane emissions events and their resulting health impacts, both at the state and national levels. We expect to see these numbers continually increase as new cases are added and our methods are expanded to include midstream and downstream events.
Conclusions
The results from our initial 1,423 cases on the MRM corroborate and expand the findings of our previous paper. Nearly all cases (99.6 – 99.7%) have a modeled benzene exceedance, suggesting widespread health risks. The Combined Risk Area for these cases ranges from 1,853 to 5,713 sq mi, potentially affecting between 51,839 to 120,283 people and putting between 53 to 90 sensitive facilities at risk. State- and basin-aggregated numbers provide policymakers, residents, and other stakeholders with targeted information to understand how methane emissions events may be contributing to health risks in their state. As more data is added to the MRM, we expect these numbers to increase significantly.
This research is part of PSE Healthy Energy’s Methane + Health Initiative, a multi-year research initiative to improve the scientific and public understanding of the link between methane emissions, air pollution, and public health.