Meet Kelsey Bilsback, PhD, a Principal Scientist at PSE Healthy Energy who is building new tools that show the health risks of methane emissions events.
What is your education background?
I have a bachelor’s in physics from Boston University and a PhD in mechanical engineering from Colorado State University.
What got you interested in physics?
When I started as an undergrad, I thought I wanted to go into astrophysics. I had imagined that I was going to be studying beautifully colored galaxies, but in my first astronomy lab, I ended up looking at tiny white dots on a black screen, and I decided that wasn’t for me. So I focused more on physics. I studied abroad at CERN, the largest particle physics laboratory in the world, located in Geneva, Switzerland. It was such a cool experience to be working at a lab with thousands of other scientists, who were all so smart and just as nerdy as I was.
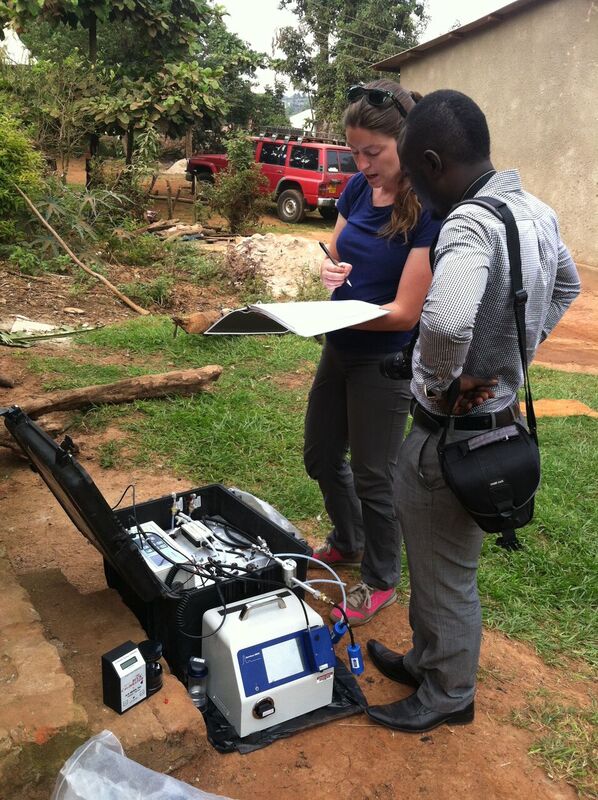
Kelsey traveled to China, Honduras, India, and Uganda to study air pollution from cookstoves for her PhD. Photo courtesy of Kelsey Bilsback.
And then you decided to pursue a PhD in mechanical engineering?
I wanted to transition to something with more real-world impact. Mechanical engineering felt more applied. I wanted to move to Colorado because I love the outdoors. So I applied to schools there and went to Colorado State. My PhD advisor asked me if I wanted to travel. I thought that sounded good, and so I ended up studying air pollution from cookstoves, and that took me to China, Honduras, India, and Uganda.
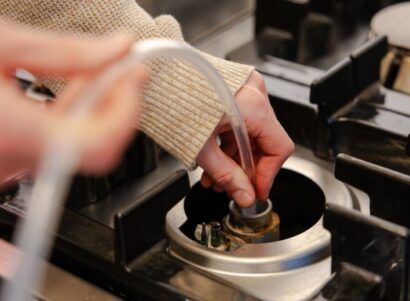
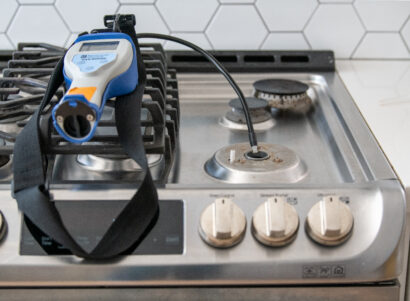
We had two big samplers that we were lugging all over the world—on and off planes, rolling our carts through rural villages—so we could take measurements of cookstove air pollution. Around the time I was doing that work, there were all these new cookstoves going to market, but it wasn’t clear that the new models actually had climate or health benefits. It’s expensive for a family to buy a new cook stove, so we were basically looking at whether the data showed that the new stoves were worth buying.
What did you do after grad school?
I worked in an atmospheric science lab where I became interested in air quality computer modeling. The cool thing about modeling is that you get to test different ‘what if’ scenarios. You can evaluate how different decisions or policies might impact air quality, public health, and climate. We were using models to look at how different energy policies would impact air quality and climate. For example, several years ago, local governments in Beijing and several surrounding provinces banned residential coal use, so we used a model to look at what the health impacts would be. That experience modeling prepared me for what I’m doing now at PSE.
Tell me about your work here at PSE.
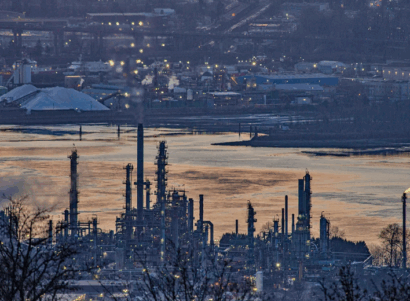
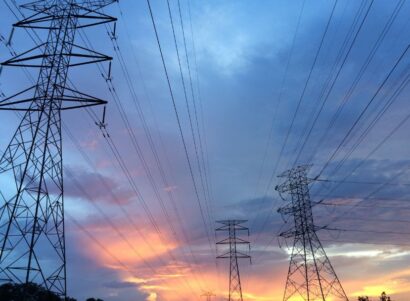
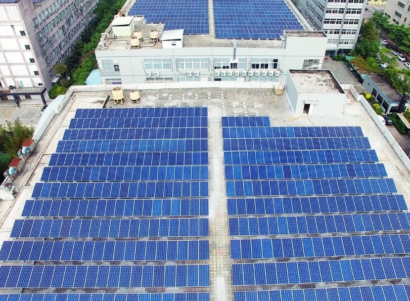
I started at PSE in 2021, and a few months into my time here, I started a small project studying upstream gas composition. At the time, and to this day, natural gas, which is mostly made up of methane, is primarily understood and regulated as a climate threat. However, years of work at PSE have shown that natural gas is much more than just methane. It’s actually a chemical soup. With new methane super-emitter data pouring in from aircraft and satellites, we aimed to translate these data into a clear picture of the health risks these events posed. A lot of my early work here was to set up the scientific methodology for modeling these health risks, starting with understanding what data on gas composition were available systematically across the US.
We had a breakthrough when we figured out that regulatory air permits include gas composition data in many states–there’s a ton of information that’s hard to find, but discoverable if you know where and how to look. So we just started sending data requests to regulators, digging into public databases, and mining all the data we could find. We spent roughly four years collecting and combing through the data, and we ended up building a massive gas composition database–the most comprehensive species-specific gas composition database in the US–and found that across the country, nearly every gas sample contained hazardous air pollutants, including a pollutant called benzene, which is really bad because it’s a carcinogen.
We wanted to figure out how to use the gas composition data we had collected to model real-world events and evaluate real-world impacts. And that was the beginning of the Methane Risk Map–or the MRM for short–which just launched in August.
Can you explain what the Methane Risk Map is?
So I should start by saying that PSE has been doing research on oil and gas, specifically studying what is in natural gas besides methane, for many years before I joined. PSE has been pushing this field forward for a long time. There’s a huge amount of expertise on our team. We have epidemiologists, statisticians, meteorologists, atmospheric scientists, exposure scientists, environmental engineers, and mechanical engineers. We have people who have degrees in public health and people who have amassed a deep understanding of how the oil and gas supply chain works.
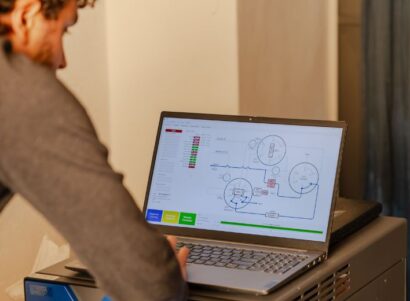
The Methane Risk Map is a way of integrating all the expertise and years of research on the health implications of oil and gas and applying it to real situations in ways that will be immediately useful to communities, regulators, and policymakers. It’s an interactive digital map that visualizes the air concentrations of hazardous air pollutants that are associated with individual upstream methane emissions events. It shows the impact of those pollutants on air quality and the risk to people’s health; it’s the first and only tool that shows the public health risk of methane super-emitter events across the US.
To phrase it another way, methane emissions from the oil and gas industry have primarily been understood as a climate problem. The Methane Risk Map shows that methane super-emitters are as much a health problem as a climate one. Making that link—and giving communities open access to the data—could be a game changer for how oil and gas pollution is regulated.
Wow, so you’ve really been focused on air pollution for your whole career.
Air pollution is one of the top two risk factors for premature death on the planet. It’s a problem we can solve.
And what is your role in the Methane Risk Map?
I’m the principal investigator, and that role has changed as the project and our team have grown. At the beginning, I was really in the weeds, supporting the modeling for individual methane emissions events that are plotted on the Methane Risk Map. Now, my focus is on guiding the bigger picture: listening to our diverse team of scientists, bringing together their perspectives and expertise into a clear vision and strategy, and communicating it so that everyone is rowing in the same direction. Another part of my role is going out into the world—sharing our work, hearing how it resonates with different people, and bringing that feedback back to the team so the project keeps improving and stays connected to the needs of the communities it’s meant to serve.
As scientists, we can study a single methane emissions event for years and get a super deep understanding of that one event. Or we can build something that’s more generalizable and more useful to real people who are experiencing the health implications of these events. We knew we wanted the Methane Risk Map to be used nationally, so we had to make careful decisions every step of the way to think through how we could model hazardous air pollutants for thousands of events, while still keeping our methodology scientific, precise, and accurate. Ultimately, it comes down to careful technical decision-making.
How did you figure out what would make the Methane Risk Map most impactful?
We talked with the people on the ground where these events are happening. We talked with a lot of advocates and regulators from communities who live right near oil and gas operations. A lot of the time, people can point to the polluters in their communities. They know that they are being exposed to unhealthy air, but they lack science-backed data to pinpoint and demonstrate what is creating the health risk.
That’s part of the reason why we decided to use regulatory-grade models for the tool–so our methodology uses the same standards that regulators use. The Methane Risk Map helps bridge the gap between what communities experience and the information that regulators need to make decisions that can help protect public health. It was input from community partners that inspired some important features on the MRM, like the ability to download a PDF report that can be attached to a legal filing, for example.
What has it been like to see this product that you’ve been developing for years finally launch?
This was the first large-scale product that I’ve been at the helm of, and it’s been very cool to watch it start as an idea and turn into something that is really compelling and useful. I’m relieved, and super excited to see it out in the world now. There has been a lot of engagement from partners following the launch, and that highlights for me how much more work there is to do. This isn’t just a product launch—it’s about changing how we understand the health risks of methane super-emitters in oil and gas and putting science-backed actionable data into the hands of those who can stop the emissions.
Have you heard from partners about any use cases yet?
Yes, we’ve heard from various people in different kinds of jobs and organizations, though I’m not sure how much I can share about their plans yet. I’ll say that the MRM has only been out in the world for about a month, so we are very excited to hear all the different ways that people are already engaging with the work, and finding applications for it in their own work. It seems to be igniting a lot of different conversations and possibilities for follow-up.
What comes next?
Well, we launched a product and a new body of science. Now, we need to ensure that it’s used. I’m probably going to be on the road a lot more, talking to a lot more people about how they might use the MRM, and how we can continue to update and change it, and then bring all that information back to the team so we can continue to make the MRM even better and more impactful.
We also want to expand the MRM to include the midstream and downstream sectors of the gas supply chain. We’re also hoping to expand its geographic scope internationally, so we will be looking for partners on the ground in different countries to help bring this data to a global scale.
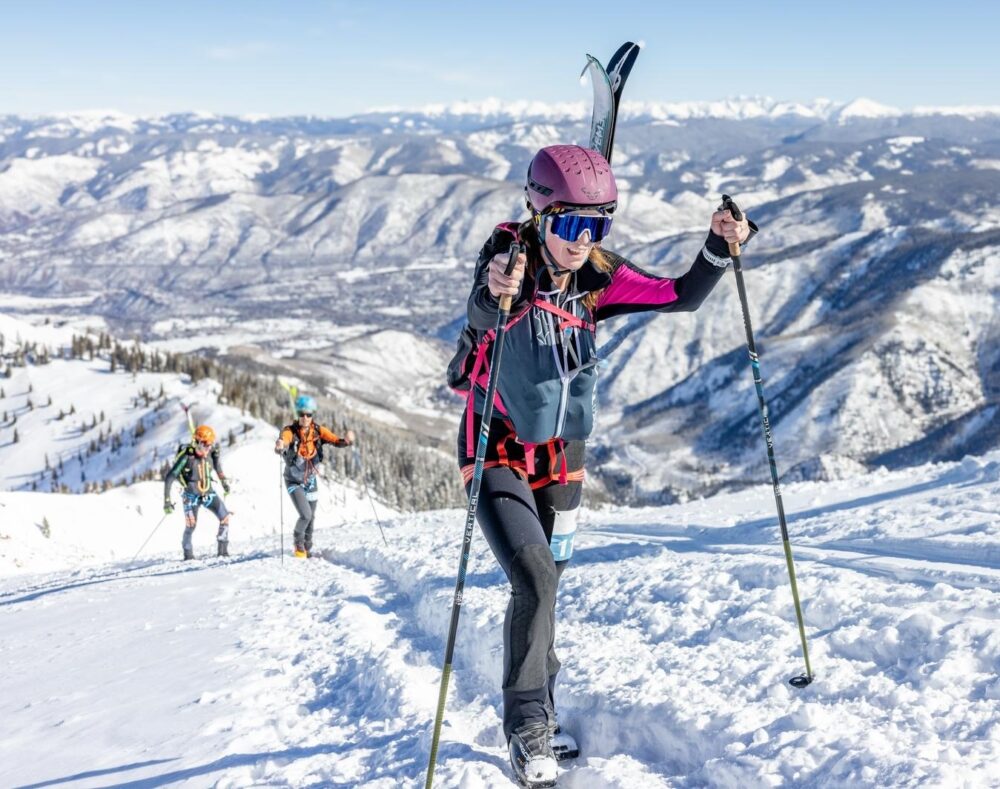
Kelsey Bilsback ski mountaineering in her free time. Photo courtesy of Kelsey Bilsback
So when you’re not leading teams and building tools that change our understanding of our energy system, what do you do in your free time? What are your hobbies?
Pretty much any endurance sport. Lately, I’m into ski mountaineering, which is where you hike up mountains on skis and then ski down the gnarliest terrain you can find. Something I’m really proud of is that I had a daughter last October, and four months postpartum, I placed second in the Power of Four, one of the biggest ski mountaineering races in Colorado, which is about 25 miles and over 10,000 feet of elevation gain.
What would you tell young people considering doing a career in scientific research?
I’d say, go for it. It’s awesome!