Lee Ann Hill
Director of Energy and Health
School of Public Health at University of California, Berkeley
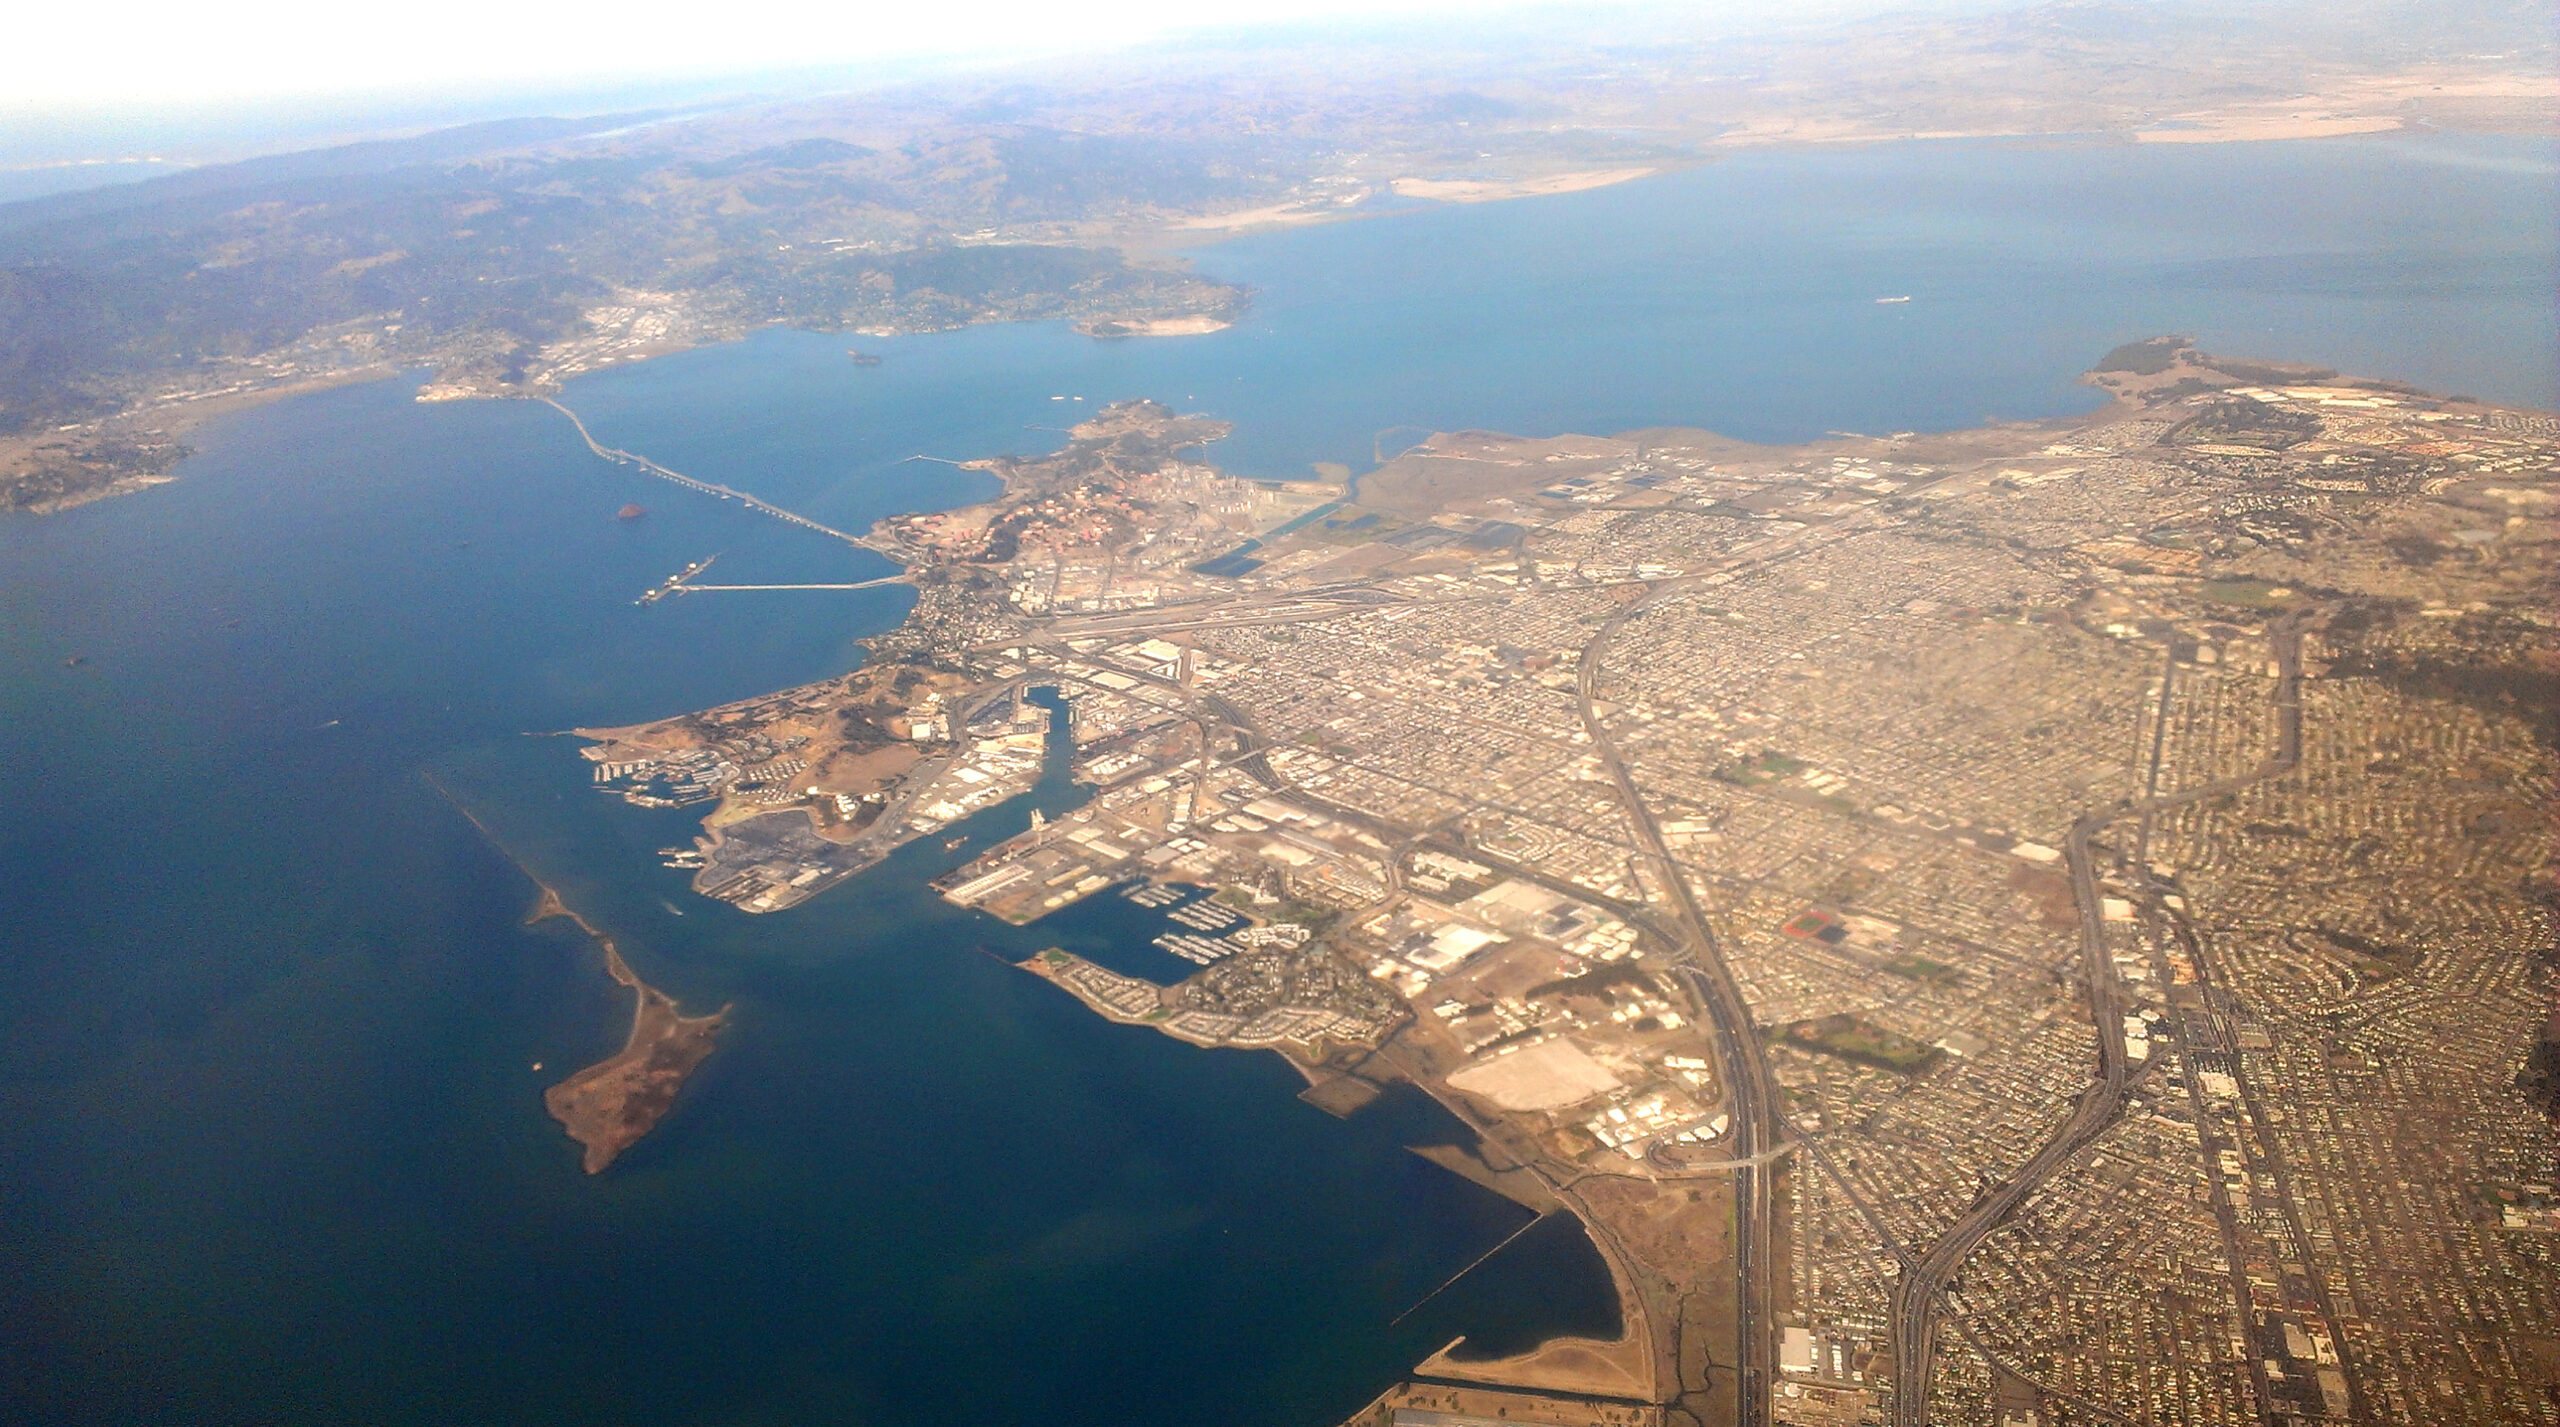
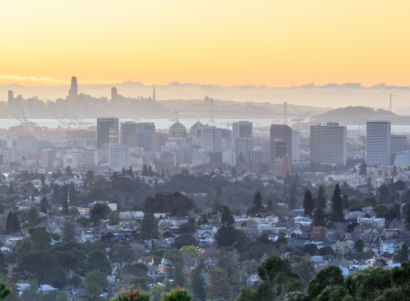
The Richmond-San Pablo area, located in San Francisco Bay Area’s East Bay, is home to many air pollutant emissions sources, including a refinery, a coal terminal and accompanying rail lines, three major highways with heavy commuter traffic, and various other industrial and transportation activities. Many communities in the region are designated as disadvantaged by CalEnviroScreen. These communities have high percentages of low-income residents and people of color, who experience some of the highest asthma rates in the state.
Physicians, Scientists, and Engineers (PSE) for Healthy Energy, in collaboration with the Asian Pacific Environmental Network (APEN), first began collecting air quality data in Richmond, North Richmond, and San Pablo in December 2019. Our multi-year air monitoring project is part of a larger effort to understand and improve air quality in Richmond-San Pablo. The work is funded through the Assembly Bill 617 Community Air Grants Program and is scheduled to continue through Spring 2022.
Currently, our stationary sensor network—the Richmond Air Monitoring Network—includes 50 Aeroqual AQY monitors that collect air quality data every minute of the day at locations across the community. Our air monitors measure particulate matter (PM2.5), nitrogen dioxide, ozone, temperature, relative humidity, and dew point. This dense network can help capture changes in air quality with heightened spatial and temporal resolution—significantly increasing the total number of air pollutant measurements collected over time and across space.
At the start of the COVID-19 pandemic, we reported measurable changes in local air quality associated with behavioral changes related to shelter in place mandates. Since then, we have continued to collect and analyze air quality data in the community to help inform local efforts to improve air quality. Using our interactive air quality data visualization tool, you can view air quality data from our network in real-time and over the last 90 days.
Below, we analyze neighborhood trends in air pollution from November 2020 to June 2021. This period was chosen to exclude wildfire season and focus on day-to-day air quality in Richmond-San Pablo. Please note that the data presented below are still preliminary and subject to change.
The Richmond Air Monitoring Network includes 50 low-cost air monitors located throughout 14 neighborhoods across Richmond and San Pablo. These neighborhoods were created by grouping City of Richmond Neighborhood Councils into larger areas, with the goal of having more than one monitor within each. Neighborhoods located in the center of the community (North Richmond Heights, East Richmond Heights, and San Pablo) generally have more air monitors, while neighborhoods on the outskirts of the community, like May Valley, Hilltop, and the Richmond Annex, have fewer monitors throughout but are still captured by the air monitoring network.
While most neighborhoods have 2-4 monitors, some centralized areas, like North Richmond Heights and San Pablo, have 7-9 monitors. Other smaller neighborhoods, like adjacent Belding/Wood, only have one monitor. Neighborhoods with a higher density or quantity of air monitors may have finer spatial data resolution than neighborhoods with fewer monitors.
Fine particulate matter (PM2.5) can negatively impact human health. Exposure to PM2.5 can exacerbate respiratory illnesses like asthma or cause lung disease, contribute to heart and neurological conditions, and make people more susceptible to lung infections, regardless of underlying health conditions. Amid the pandemic, numerous studies have reported that exposure to PM2.5 is associated with excess COVID-19 cases and deaths and elevated COVID-19 mortality rates. Chronic exposure to air pollution is also linked to race and poverty, and a recent study indicates Latinos in California are overrepresented in cumulative COVID-19 cases statewide.
Our analysis examines average monthly and seasonal PM2.5 concentrations in each of the 14 neighborhoods from November 2020 to June 2021 to compare neighborhood-level air quality differences. These trends cannot be discerned with regulatory monitoring alone, since PM2.5 is measured by only one regulatory air monitor in Richmond-San Pablo.
Average neighborhood PM2.5 concentrations in winter (November 2020 – February 2021) and spring (March – June 2021) are shown below. The winter network-wide average PM2.5 was 10.3 micrograms per cubic meter (µg/m3). Four neighborhoods exceeded this network average: Hilltop, Point San Pablo, Point Richmond, and May Valley. In the spring, the network-wide average PM2.5 was 8.5 micrograms per cubic meter, lower than the network-wide average in the winter. Five neighborhoods exceeded this spring network-wide average: San Pablo, Point Richmond, May Valley, Hilltop, and the Richmond Annex/Parkview. Hilltop and May Valley exceeded the network average in both winter and spring. Further analysis is needed to investigate the above-average PM2.5 concentrations observed in these select neighborhoods. Meanwhile, average PM2.5 concentrations in Iron Triangle/Atchison Village, Marina Bay, North Richmond, and Coronado/Santa Fe were slightly below the network average PM2.5 in both winter and spring.
The maps below show average neighborhood PM2.5 concentrations in winter and spring. Darker shades of red show communities where the PM2.5 concentrations were above the network average, while darker shades of blue are areas where the PM2.5 concentrations were lower than the network average for their respective season.
We also evaluated average monthly PM2.5 concentrations for each neighborhood for the November 2020 – June 2021 time period. In the boxplot below, each box represents a neighborhood and each color-coded dot shows the neighborhood’s monthly average PM2.5 concentration. Across all neighborhoods, December 2020 had by far the highest average PM2.5 concentrations, with May 2021 having the second highest. May Valley, a neighborhood that had higher-than-average winter and spring average PM2.5 concentrations, had the largest range in average monthly PM2.5 levels. You can explore the interactive boxplot and map below to examine average monthly PM2.5 concentrations for each neighborhood.
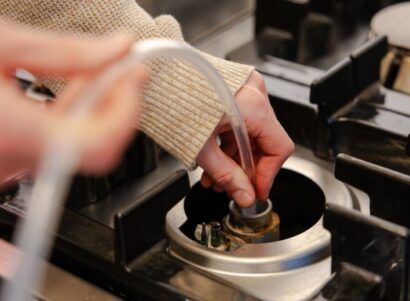
In collaboration with APEN and researchers at the Lawrence Berkeley National Laboratory (LBNL), and with funding through an additional AB 617 Community Air Grant, we have recently completed three one-month-long monitoring campaigns to collect black carbon (soot) measurements. Black carbon is formed through the incomplete combustion of fossil fuels and biomass, and is a primary component of diesel particulate matter, a recognized toxic air contaminant in California. These additional measurements of black carbon will allow for further evaluation of diesel combustion in the area (e.g., truck activity) and evaluation of these emissions in the context of other PM2.5 sources in the community.
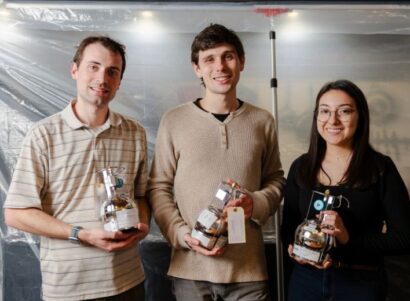
These three air monitoring campaigns used Aerosol Black Carbon Detectors, designed by researchers at LBNL, that were co-located with our stationary network sites throughout the community. The campaigns were conducted during different seasons, including during a wildfire smoke event in August 2020, the winter months of January and February 2021, and summer months of May and June 2021. All three air monitoring campaigns are now completed and we are currently in the process of analyzing the black carbon data.
Our data collection and analysis efforts will continue through Spring 2022. Additional updates from the Richmond Air Monitoring Network will be posted on a regular basis—please stay tuned!
Questions?
If you have questions or inquiries regarding the Richmond Air Monitoring Network, please contact: Senior Scientist Boris Lukanov, PhD at blukanov@psehealthyenergy.org.