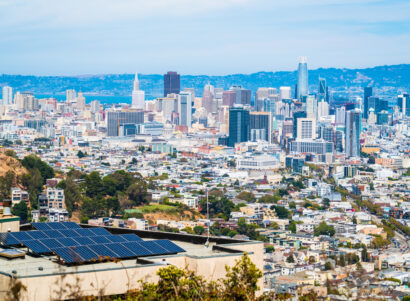
The world looks different now than it did a few months ago before the novel coronavirus began to spread, and the San Francisco Bay Area is no exception. Parking lots are vacant, highways are empty, grocery store lines run down the street, and hiking trails are full. Early evidence suggests that the region’s shelter in place order, along with the associated social and economic changes, may have slowed the spread of the novel coronavirus, reducing cases of COVID-19 respiratory disease and likely saving many lives. But there are less visible impacts as well — to the air we breathe. PSE’s network of air monitors in Richmond, CA is showing that air quality in Richmond has changed measurably during this time, though not entirely for the better. Like parking lots and grocery stores, the air is emptier of some pollutants but fuller with others.
Air pollution can impact human health in insidious ways. It can exacerbate respiratory illnesses like asthma or cause chronic obstructive pulmonary disease, contribute to cardiovascular and neurological ailments, and make people more susceptible to lung infections, regardless of underlying health conditions. A recent coronavirus-related study found that polluted communities may suffer elevated COVID-19 mortality rates. Another study from 2003 found that increased air pollution was associated with higher mortality rates among those infected with Severe Acute Respiratory Syndrome (SARS), a close relative of the current strain of coronavirus. Chronic exposure to air pollution is also linked to race and poverty, and new evidence suggests higher COVID-19 mortality rates among African-Americans.
Some of the most notorious health-harming air pollutants include nitrogen dioxide (NO2), fine particulate matter (PM2.5), and ozone, all of which can cause respiratory and cardiovascular illness and other health problems. These pollutants come from a range of sources: most NO2 in urban settings is emitted by automobiles and some stationary sources; PM2.5 is sourced directly through combustion processes, industry, and vehicles, as well as through interactions between other pollutants in the atmosphere; and ozone is not emitted directly, but forms from other pollutants such as nitrogen oxides and volatile organic compounds in the atmosphere in the presence of sunlight and elevated temperatures. All three pollutants are regulated and monitored by the State and Federal government — but typically on a regional scale that makes it difficult to thoroughly characterize community-level exposure and pollution burden.
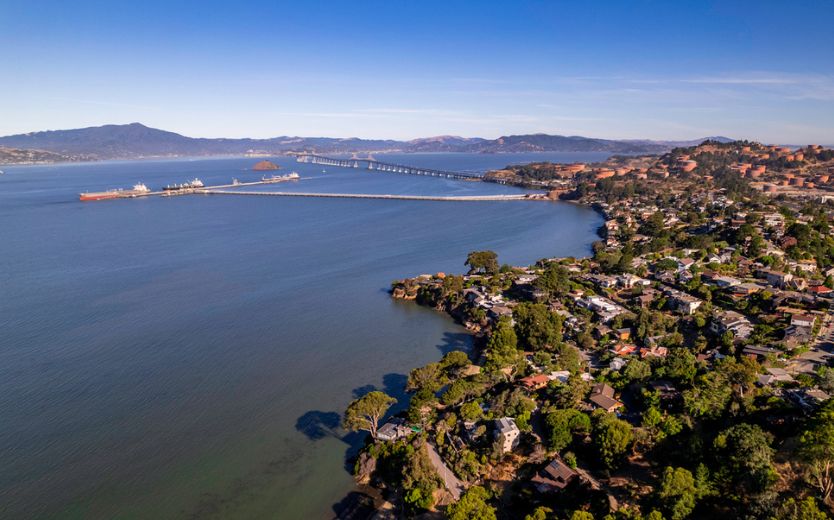
In Richmond, a community on the northeastern edge of the San Francisco Bay, air pollution has long been a focal issue. The area is impacted by a myriad of emissions sources, including a refinery, coal transport via train and the port terminal, three major highways with heavy commuter traffic, and various other large and small industrial facilities. Demographically, the Richmond community is composed largely of minority and low-income populations that experience some of the highest asthma rates in California. Despite these risk factors, there is only one regulatory air monitoring site located in the nearby city of San Pablo currently measuring health-harming “criteria pollutants” such as ozone and NO2. As a result, there is significant interest in better understanding Richmond’s air pollution burden on the community level.
Particulate Matter Decreased Following Shelter in Place Mandates, Ozone Increased


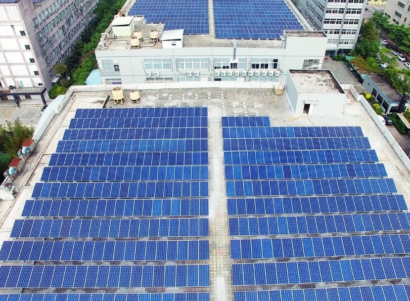
PSE has worked alongside community stakeholders over the last several months to supplement regulatory air pollution measurements with a dense network of low-cost air quality monitors. Thirty monitors currently measure air quality at strategic locations throughout the Richmond community by the minute, using the power of dense air pollution sensor networks to provide the spatial and temporal resolution needed to better understand pollution burden at the community level. Though the Richmond Air Monitoring Network’s data is intended to inform long-term clean air policies in Richmond, it can also provide interesting, shorter-term insights. As economic activity slows during shelter in place, our air pollution sensor network’s data provide insights into whether, how, and where Richmond’s air quality is changing.
We compare data collected from February 1 to March 16–the day before the Bay Area was ordered to shelter in place–to data collected in the weeks that followed (March 17 to April 20), to gauge whether changes in daily life following the order had any impact on air pollution in Richmond. We validated our Richmond Air Monitoring Network findings with data from the regulatory monitor at San Pablo Station.
As shown in the above box-and-whisker plots, our results were mixed. Median daily PM2.5 concentrations dropped from an already low value of 6.7 micrograms per cubic meter (μg/m3) prior to shelter in place to an even lower value of 3.9 micrograms/cubic meter during shelter in place, a 42 percent decrease. Additionally, the overall distribution of PM2.5 narrowed, with its upper and lower ends shifting downward, suggesting an overall reduction. NO2 followed a similar pattern.1 In contrast with PM2.5 and NO2, however, ozone increased during shelter in place.2 Median daily ozone for the period prior to the shelter in place order was 30.0 parts per billion (ppb) and increased by 11 percent to 33.7 ppb as residents stayed home and essential industries continued to operate.
The above observations are based on aggregating our entire air pollutant sensor network’s daily pollutant averages and examining their distribution. To better understand whether these patterns were consistent throughout Richmond, we broke down the data by monitor, plotting each individual location’s daily average values, superimposed with the network-wide daily average. In addition to the daily average, we took the network-wide average for the period before and after the shelter in place for each pollutant. This provides a more detailed look into temporal patterns, as well as insights into whether any monitors deviated from the patterns observed on a network-wide level.
On a network-wide basis, PM2.5 decreased from an average of 6.9 μg/m3 to 4.9 μg/m3 when comparing the period before to the period after shelter in place. Ozone increased from an average of 30.5 ppb before to 34.1 ppb after. Intra-network agreement was relatively good, with all monitors following roughly the same patterns in PM2.5 and ozone concentrations. Individual monitors had different daily averages from one other, which is to be expected and captures potentially meaningful spatial variation. All monitors within the network followed a similar general pattern of higher ozone and lower PM2.5 and NO2 after the shelter in place order was implemented. Particularly interesting is the observed divergence between ozone and PM2.5/NO2. However, this is consistent with a frequently observed phenomenon that when other pollutants go down, ozone may increase.


Areas Near Highways and Railroads See the Greatest Decreases in Pollutants


The above suggests that our monitors are capturing a region-wide change in air pollution. To examine further how the magnitude of change may vary on smaller spatial scales, we took the average of each air monitor’s pollution measurements before and after shelter in place and calculated the difference, then used an inverse distance weighted interpolation to visualize how air pollution has changed at locations between monitors. This simple method can provide a general sense of how pollution may be changing across Richmond.
Once again, the data were fairly consistent. Some of the areas with the greatest decreases in PM2.5 and NO2 were near highways and railroad rights-of-way, pointing toward decreased traffic as a possible driver of the observed decrease in pollution. The greatest increases in ozone occurred in locations adjacent to some of Richmond’s most industrial areas, suggestive of continued emissions of ozone precursors from “essential” industrial sites. However, it is worth noting that observed locational differences for all pollutants were relatively small, and the data were mostly consistent throughout Richmond.
COMMUNITY-WIDE LOCKDOWN MEASURES CHANGE THE AIR WE BREATHE
Unsurprisingly, our Richmond Air Monitoring Network data suggest that COVID-19 mitigation efforts may change, and improve, the quality of the air we breathe — a (temporary) silver lining for communities chronically exposed to high levels of air pollution, during a time of social and economic disruption. Unfortunately, as air pollution levels for most pollutants have decreased in Richmond and the rest of the US, the federal government has taken advantage of the global pandemic to roll back environmental regulations and undermine public health protections.
Federal regulators are now using the COVID-19 crisis as an excuse to relax enforcement on polluting facilities. The Environmental Protection Agency recently gave coal power plants and other regulated facilities more leeway on pollution control measures, citing coronavirus-related economic hardship, and then announced additional rollbacks of auto pollution rules. Ironically, these standards were designed with public health in mind, and are intended to protect people from ailments such as respiratory disease in the first place. If these policy changes remain in place following COVID-19 and regulators prioritize economic recovery over protecting the environment and public health, the current gains in air quality will be reversed. Should air pollution worsen in the long-term due to erosion of public health-protective policies and regulations, communities already burdened by health and environmental risks could become even more vulnerable to the dangers of respiratory diseases like COVID-19.
NOTES
1 NO2 data are preliminary and only allow for comparisons of relative concentrations between the period before and the period after shelter in place.
2 O3 data are also preliminary (not calibrated).