PSE Energy Quarterly is the newsletter of Physicians, Scientists, and Engineers for Healthy Energy, a nonprofit research institute dedicated to supplying evidence-based scientific and technical information on the public health, environmental, and climate dimensions of energy production and use.
TOP STORY
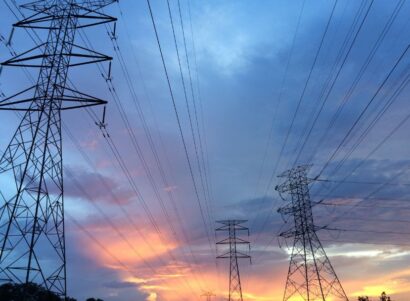
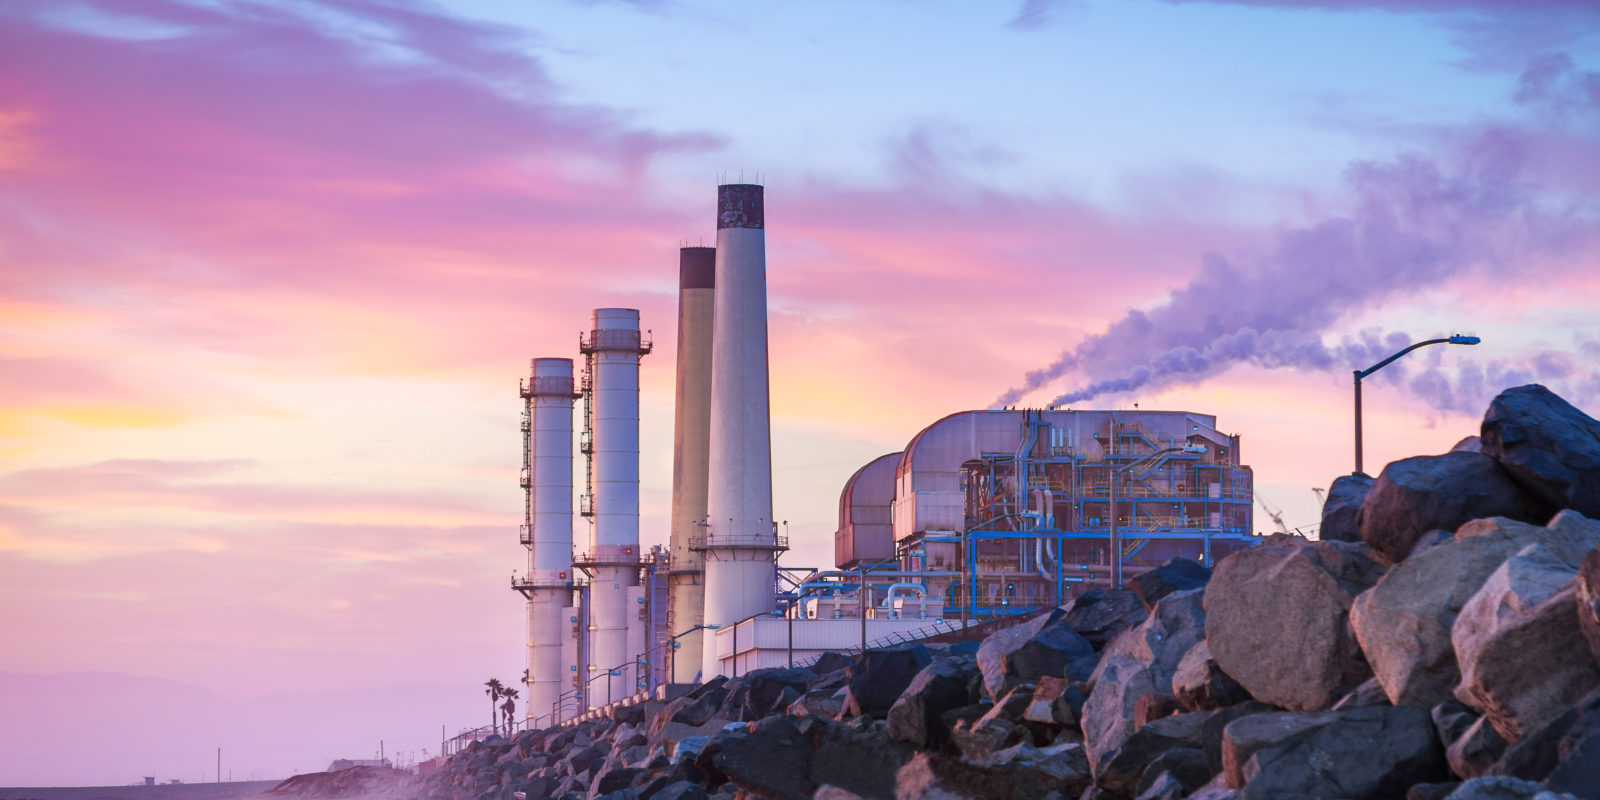
Which power plant in your region is the worst polluter and who lives nearby? A new interactive, map-based website launching today (November 15) allows users to explore and analyze data on fossil-fuel-burning power plants by viewing information such as location, operations and emissions — alone or in relation to other data, including local demographics and environmental justice indicators. The free site, called the California Power Map, is designed to help users — especially public agencies, researchers, journalists, and citizen groups — access and analyze power-plant data based on their own questions. Physicians, Scientists and Engineers for Healthy Energy (PSE), an Oakland, California-based nonprofit energy science and policy research institute, built the site.
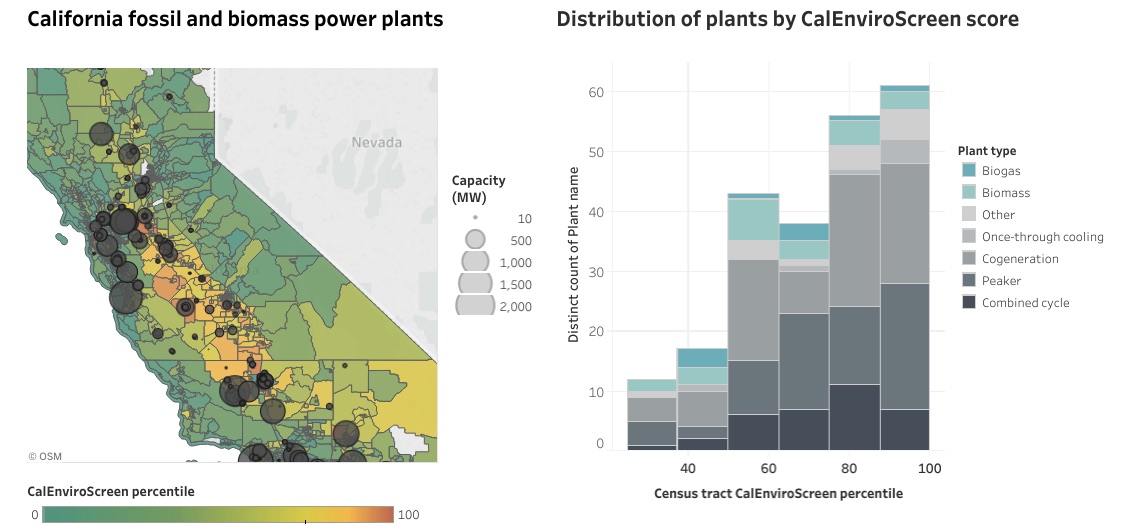
Users can zoom in on a statewide view or compare specific attributes, such as CalEnviroScreen score.
Choosing from numerous menus and filters, users can view data such as greenhouse gas emissions and hours of operation and can select geographical regions such as counties or utility service areas (PG&E, for example). Customized views can be shared as links or displayed as embedded graphics in other sites. Much of the site’s information exists in different maps or datasets across federal and State websites but the California Power Map integrates disparate sources of information to allow for easy comparison across datasets.
“These maps help directly answer the kinds of questions I regularly hear, such as: ‘In which communities are power plants located? Which plants would we want to take offline if we had alternatives?’” said Elena Krieger, PhD, the director of PSE’s clean energy research program, who built the site. “The answers can help inform strategies for shifting to clean energy in an orderly, sensible way, with data-driven decision-making, such as phasing out the most polluting plants in the most populous areas first.”
Go to the California Power Map.
Read the complete story.
Take a walk-through tutorial on the PSE blog.
")
NET CARBON ZERO In late September, Governor Jerry Brown launched the Global Climate Action Summit in San Francisco by announcing a sweeping and unprecedented climate target for the state of California: full carbon neutrality by the year 2045. He simultaneously signed into law a senate bill requiring one hundred percent of the state’s electricity to be produced by zero-carbon resources by 2045. The latter act stole the headlines but is, in fact, the far less ambitious of the two targets: One-hundred percent renewable electricity is just one of the many building blocks needed to achieve economy-wide net zero carbon emissions. Read the complete opinion piece on the PSE blog.

DOCTORS RESPOND TO IPCC The BMJ, the journal of The British Medical Association, published an opinion piece by PSE’s board president Dr. Adam Law, co-authored with three England-based physicians, that responds to the dire climate change timelines described in the widely publicized October 8 report of the Intergovernmental Panel on Climate Change. Acknowledging the report’s 12-year time frame for action to avoid catastrophic climate impacts, the authors point to physicians’ “strong record of steering society to make difficult, unpopular, and at times expensive choices for the sake of public health and safety.” Such efforts have led to changes that include improved sanitation, water treatment, and air quality, the authors say, and they call for immediate, emergency-scale leadership from doctors. Read the editorial.

FINKEL BOOK RELEASES PSE Board member Madelon Finkel’s new book Pipeline Politics: Assessing the Benefits and Harms of Energy Policy, published September 30 by Praeger, discusses the pros and cons of transporting oil and natural gas by pipeline — including the Keystone XL and Dakota Access pipelines — and by other means. She offers a geopolitical assessment of oil, gas, and global energy politics and discusses issues of environmental justice and the development, implementation, and enforcement of pipeline laws, regulations, and policies. Finkel presents a book talk at Cornell University November 15. Buy the book.

DIGIULIO ON WYOMING PANEL Senior Research Scientist Dominic DiGiulio joined hydrologists on the panel “Pavillion Area Oil and Gas Contamination,” an October 18 public forum held at Central Wyoming College on the connection between water contamination and hydraulic fracturing activities in Pavillion, Wyoming. The panel explored the extent of contamination, the status of cleanup efforts, and the decreasing availability of fresh water in the region, which experienced an oil and gas development boom starting in the early 2000s, when regulations eased. DiGiulio has studied the issue since 2010, including four years as a staff scientist at the U.S. Environmental Protection Agency, where he authored a seminal 2011 report on the impacts of unlined wastewater pits on groundwater contamination. Read an in-depth article covering the event in Wyofile, a Wyoming-based nonprofit news site.

SHONKOFF BRIEFS AGENCIES Senate Bill 826 charged the California Council of Science and Technology with providing the State with up-to-date information on all active underground natural gas storage fields in California. Scientists presented their first such report, titled “Long-Term Viability of Underground Natural Gas Storage in California: An Independent Review of Scientific and Technical Information,” to the California Public Utility Commission and other state agencies on August 28 in Los Angeles. As the first author of the human health section, PSE Executive Director Seth Shonkoff presented a briefing on public health findings. PSE associate researchers Lee Ann Hill and Eliza Czolowski co-authored the chapter along with scientists from the Lawrence Berkeley National Laboratory, the National Institute of Standards and Technology, and the UC Berkeley School of Public Health. See the CPUC presentation.

SUPPORT OUR WORK If you’ve read this far then you have a clear idea of how PSE’s science, policy, and communication work support evidence-based policy on the environmental and human-health impacts of oil and natural gas development and on a sensible, doable path forward to clean energy. Please support our mission this Giving Tuesday, the first Tuesday after Thanksgiving. Or beat the rush and Give to PSE now.
This issue of PSE Energy Quarterly was published November 15, 2018, in Oakland, California.
Copyright PSE Healthy Energy. All rights reserved.